
hydromeso classifies depth and velocity into nominal
hydraulic mesohabitats. Install a local source package with
install.packages(path, repos = NULL, type = "source").
Exact default table
##   class_id                 label depth_min depth_max velocity_min velocity_max
## 1        1          Shallow Pool      0.00      0.61         0.00         0.30
## 2        2           Medium Pool      0.61      1.37         0.00         0.30
## 3        3             Deep Pool      1.37       Inf         0.00         0.30
## 4        4           Slow Riffle      0.00      0.61         0.30         0.61
## 5        5           Fast Riffle      0.00      0.61         0.61          Inf
## 6        6               Raceway      0.61      1.37         0.30         0.61
## 7        7   Faster than Raceway      0.61      1.37         0.61          Inf
## 8        8 Faster than Deep Pool      1.37       Inf         0.30          Inf
All lower bounds are inclusive and all upper bounds are exclusive. Exact depths 0.61 and 1.37 enter the medium and deep ranges; exact velocities 0.30 and 0.61 enter the moderate and high ranges.
Values and tables
classify_mesohabitat_values(c(0, 0.61, 1.37), c(0, 0.30, 0.61))## depth velocity mesohabitat_class mesohabitat
## 1 0.00 0.00 1 Shallow Pool
## 2 0.61 0.30 6 Raceway
## 3 1.37 0.61 8 Faster than Deep Pool
tab <- classify_mesohabitat_table(hydromeso_example, "depth", "velocity")
summarize_mesohabitat(tab)
## class_id label record_count percentage missing_count
## 1 1 Shallow Pool 3 17.647059 1
## 2 2 Medium Pool 3 17.647059 1
## 3 3 Deep Pool 2 11.764706 1
## 4 4 Slow Riffle 2 11.764706 1
## 5 5 Fast Riffle 2 11.764706 1
## 6 6 Raceway 2 11.764706 1
## 7 7 Faster than Raceway 2 11.764706 1
## 8 8 Faster than Deep Pool 1 5.882353 1Rasters and export
h <- mesohabitat_example_rasters()
r <- classify_mesohabitat_raster(h$depth, h$velocity)
summarize_mesohabitat(r)
## scenario class_id label cell_count area_m2 hectares
## 1 mesohabitat 1 Shallow Pool 470 14148.535 1.4148535
## 2 mesohabitat 2 Medium Pool 205 6171.170 0.6171170
## 3 mesohabitat 3 Deep Pool 130 3913.425 0.3913425
## 4 mesohabitat 4 Slow Riffle 823 24774.986 2.4774986
## 5 mesohabitat 5 Fast Riffle 115 3461.876 0.3461876
## 6 mesohabitat 6 Raceway 1036 31186.982 3.1186982
## 7 mesohabitat 7 Faster than Raceway 3951 118937.996 11.8937996
## 8 mesohabitat 8 Faster than Deep Pool 14604 439628.086 43.9628086
## square_kilometres acres percentage
## 1 0.014148535 3.4961791 2.2030562
## 2 0.006171170 1.5249293 0.9609076
## 3 0.003913425 0.9670284 0.6093560
## 4 0.024774986 6.1220325 3.8576918
## 5 0.003461876 0.8554481 0.5390457
## 6 0.031186982 7.7064710 4.8560981
## 7 0.118937996 29.3902190 18.5197332
## 8 0.439628086 108.6344659 68.4541114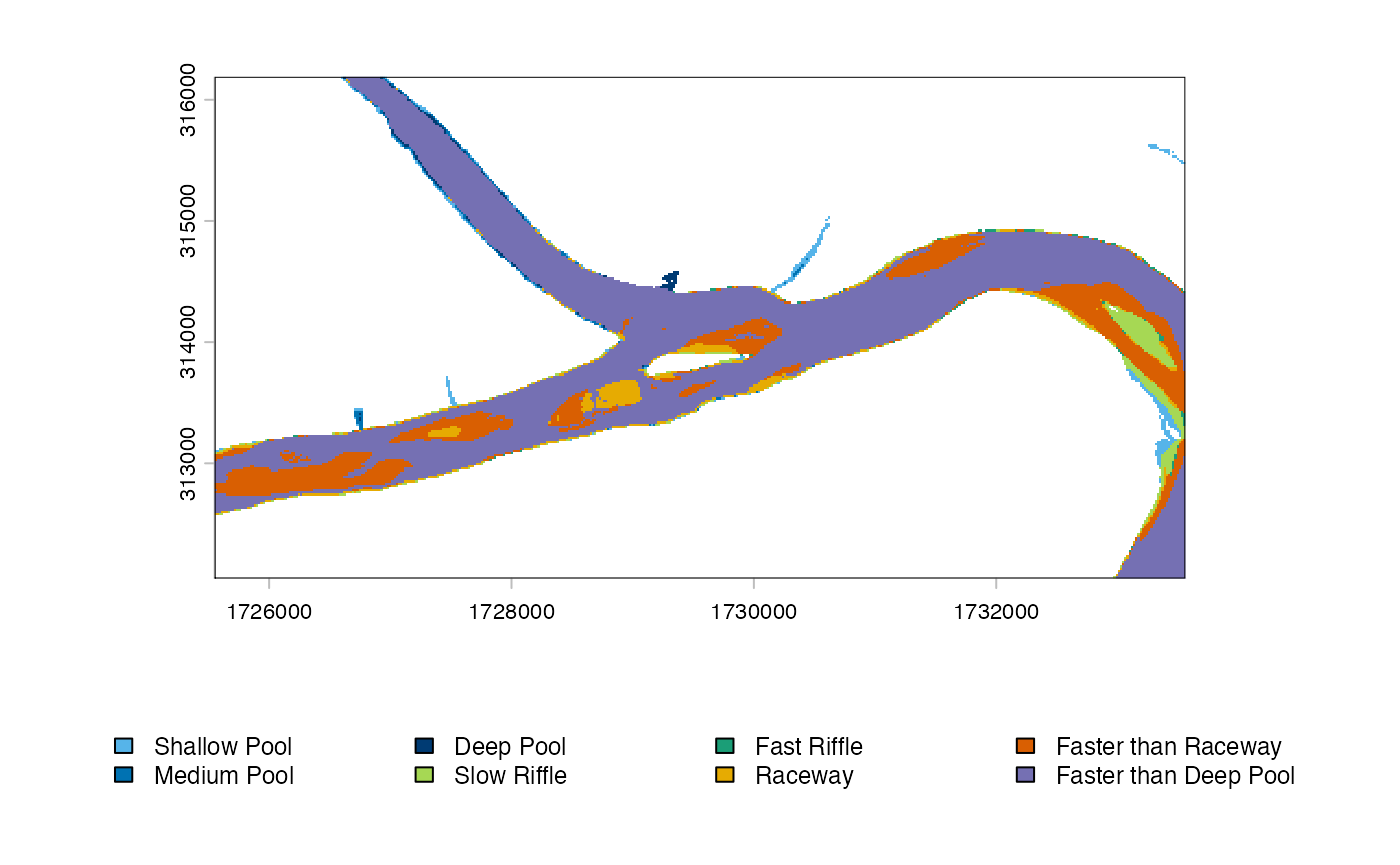
out <- file.path(tempdir(), "mesohabitat.tif")
write_mesohabitat(r, out, sidecar = TRUE, overwrite = TRUE)
The classes describe hydraulic conditions only. They are not biological habitat-suitability scores, and the integer IDs are nominal.