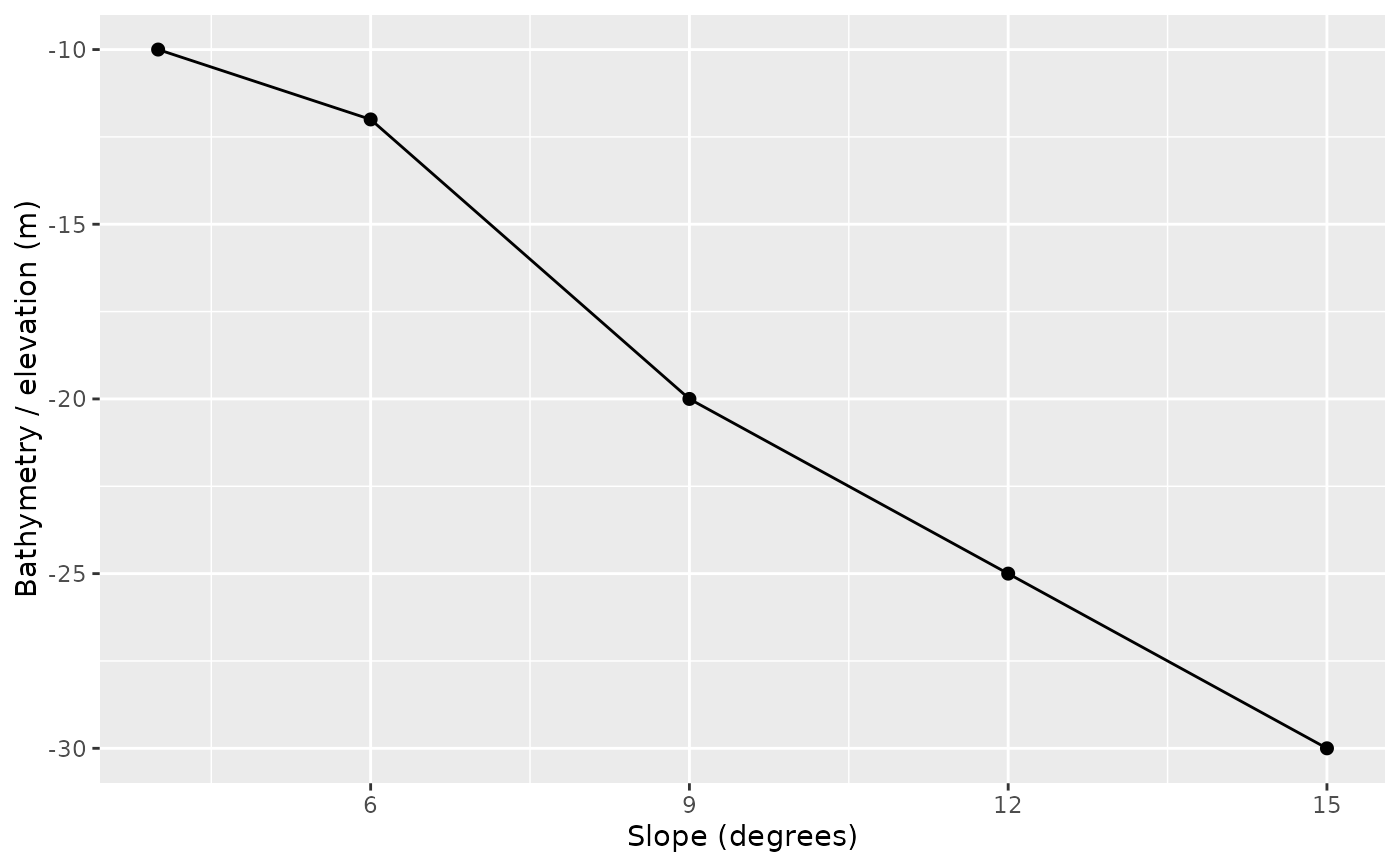
Plots sampled raster values along a transect profile or against depth.
Usage
plot_depth_profile(
  data,
  distance_col = "distance",
  depth_col = NULL,
  value_col = NULL,
  group_col = NULL,
  points = TRUE,
  line = TRUE,
  profile_layout = c("auto", "distance", "metric_by_depth"),
  profile_direction = c("top_to_bottom", "bottom_to_top", "as_sampled", "max_to_min",
    "min_to_max", "high_to_low", "low_to_high"),
  positive_depth = NULL,
  depth_increases_down = TRUE,
  title = NULL,
  subtitle = NULL,
  caption = NULL
)
Arguments
- data
A data frame.
- distance_col
Distance column name.
- depth_col
Depth or elevation column name. If
NULL, a depth-like column is inferred where needed.- value_col
Value column to plot. Use this for sampled variables such as bathymetry, slope, rugosity, BPI, or curvature.
- group_col
Optional grouping column.
- points
Logical. Draw profile points.
- line
Logical. Draw profile lines when at least two finite samples are available.
- profile_layout
Plot layout.
"auto"uses a distance profile when only one value column is supplied and uses a metric-by-depth profile when bothdepth_colandvalue_colidentify different columns."distance"plots distance on x and the selected value on y."metric_by_depth"plots the selected metric on x and depth or elevation on y.- profile_direction
Direction used to orient distance before plotting.
"top_to_bottom"(the default) orients bathymetric or elevation profiles from the shallow or top endpoint toward the deeper or bottom endpoint. With negative-elevation bathymetry this means higher numeric values to lower numeric values. With positive-depth bathymetry, setpositive_depth = TRUEso the profile runs from lower depth values to higher depth values."bottom_to_top"reverses that convention."max_to_min"and"min_to_max"provide explicit numeric endpoint controls for metrics, and"as_sampled"preserves the sampled line order. Legacy values"high_to_low"and"low_to_high"are accepted as aliases for"top_to_bottom"and"bottom_to_top".- positive_depth
Logical depth convention for
value_col. This affects top-to-bottom profile orientation for depth-like variables and y-axis display for positive-depth values.- depth_increases_down
Logical. If
TRUE, positive-depth profiles are plotted with a reversed y-axis so larger depths appear lower in the panel.- title, subtitle, caption
Plot text.
Details
With profile_layout = "distance", the y-axis can be any sampled raster
variable: elevation, depth, slope, rugosity, BPI, curvature, or a custom
metric. With profile_layout = "metric_by_depth", depth or elevation is
placed on the y-axis and the selected terrain metric is placed on the x-axis.
Metadata columns such as transect angle, offset, width, and height are
ignored during automatic value-column inference.
Examples
if (requireNamespace("ggplot2", quietly = TRUE)) {
  df <- data.frame(distance = 1:5, depth = -c(10, 12, 20, 25, 30))
  plot_depth_profile(df, depth_col = "depth")

  metric_df <- data.frame(
    distance = 1:5,
    bathy_m = -c(10, 12, 20, 25, 30),
    slope_deg = c(4, 6, 9, 12, 15)
  )
  plot_depth_profile(metric_df, depth_col = "bathy_m", value_col = "slope_deg")
}