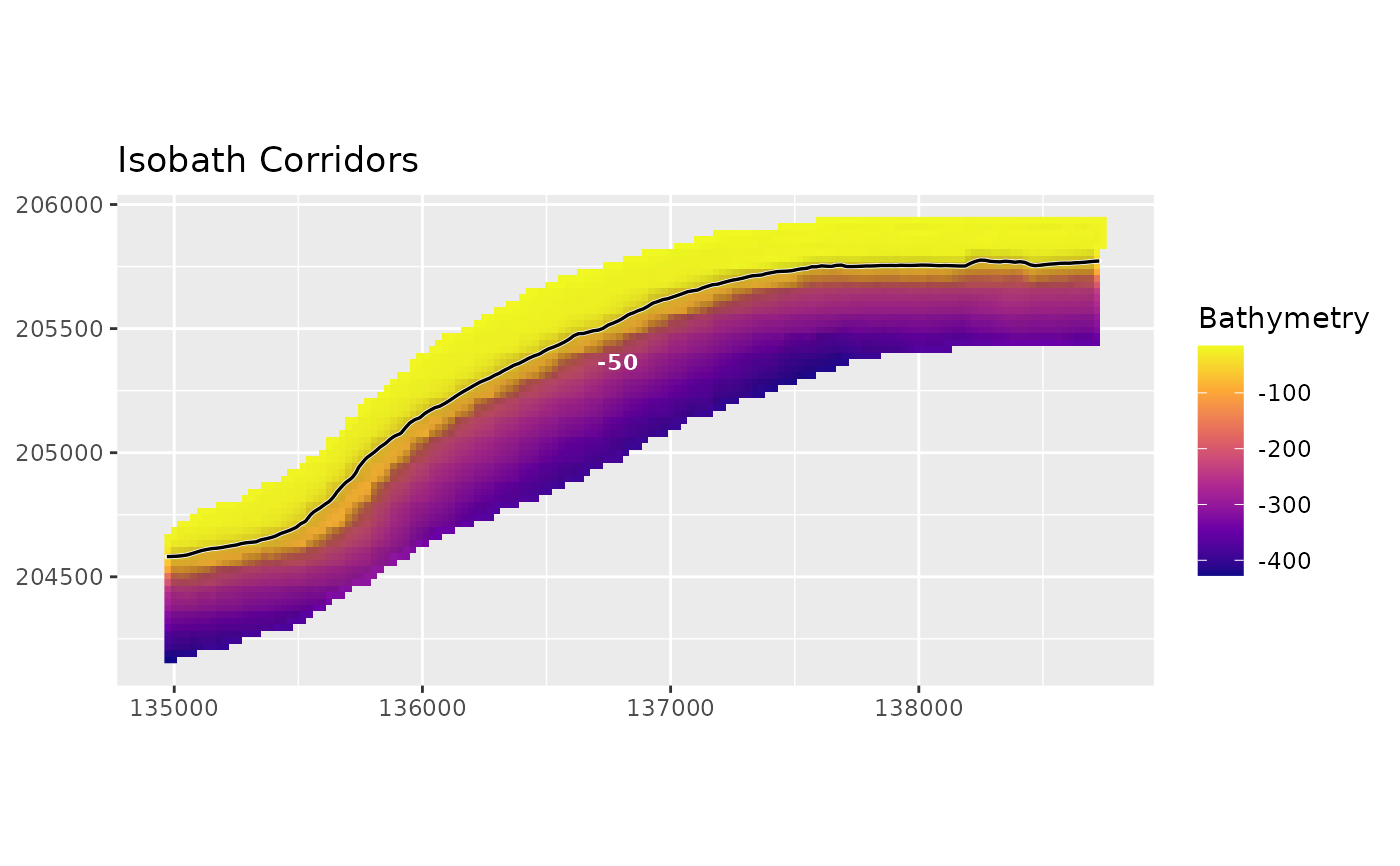
Plots isobath corridor polygons, optionally over hillshaded bathymetry with contour lines. The hillshade layer is visual context only.
Usage
plot_isobath_corridors(
  corridors,
  bathy = NULL,
  isobaths = NULL,
  hillshade = TRUE,
  background_contours = FALSE,
  source_isobaths = TRUE,
  isobath_color = "black",
  isobath_linewidth = 0.6,
  corridor_color = "white",
  corridor_linewidth = 0.45,
  corridor_fill = NA,
  corridor_alpha = 0.2,
  labels = TRUE,
  label_field = NULL,
  title = "Isobath Corridors",
  subtitle = NULL,
  caption = NULL,
  contours = NULL,
  ...
)
Arguments
- corridors
Corridor polygons.
- bathy
Optional raster background.
- isobaths
Optional source isobath lines to draw over the corridors.
- hillshade
Logical. Draw hillshade from
bathywhen available.- background_contours
Logical. Draw general bathymetric background contours. Defaults to
FALSEto keep corridor figures readable.- source_isobaths
Logical. Draw the source isobaths used to create the corridors.
- isobath_color, isobath_linewidth
Source-isobath line styling.
- corridor_color, corridor_linewidth, corridor_fill, corridor_alpha
Corridor polygon styling.
- labels
Logical. Label corridors with
label_field.- label_field
Attribute used for labels. Defaults to
depth_labelwhen present, otherwisecontour_value.- title, subtitle, caption
Plot text.
- contours
Deprecated alias for
background_contours.- ...
Additional arguments passed to
plot_bathy().
Examples
if (requireNamespace("ggplot2", quietly = TRUE)) {
  bathy <- read_bathy(blueterra_example("bathy"))
  corridors <- make_isobath_corridors(bathy, depths = -50, width = 5)
  isobaths <- extract_isobaths(bathy, depths = -50)
  plot_isobath_corridors(corridors, bathy, isobaths = isobaths)
}