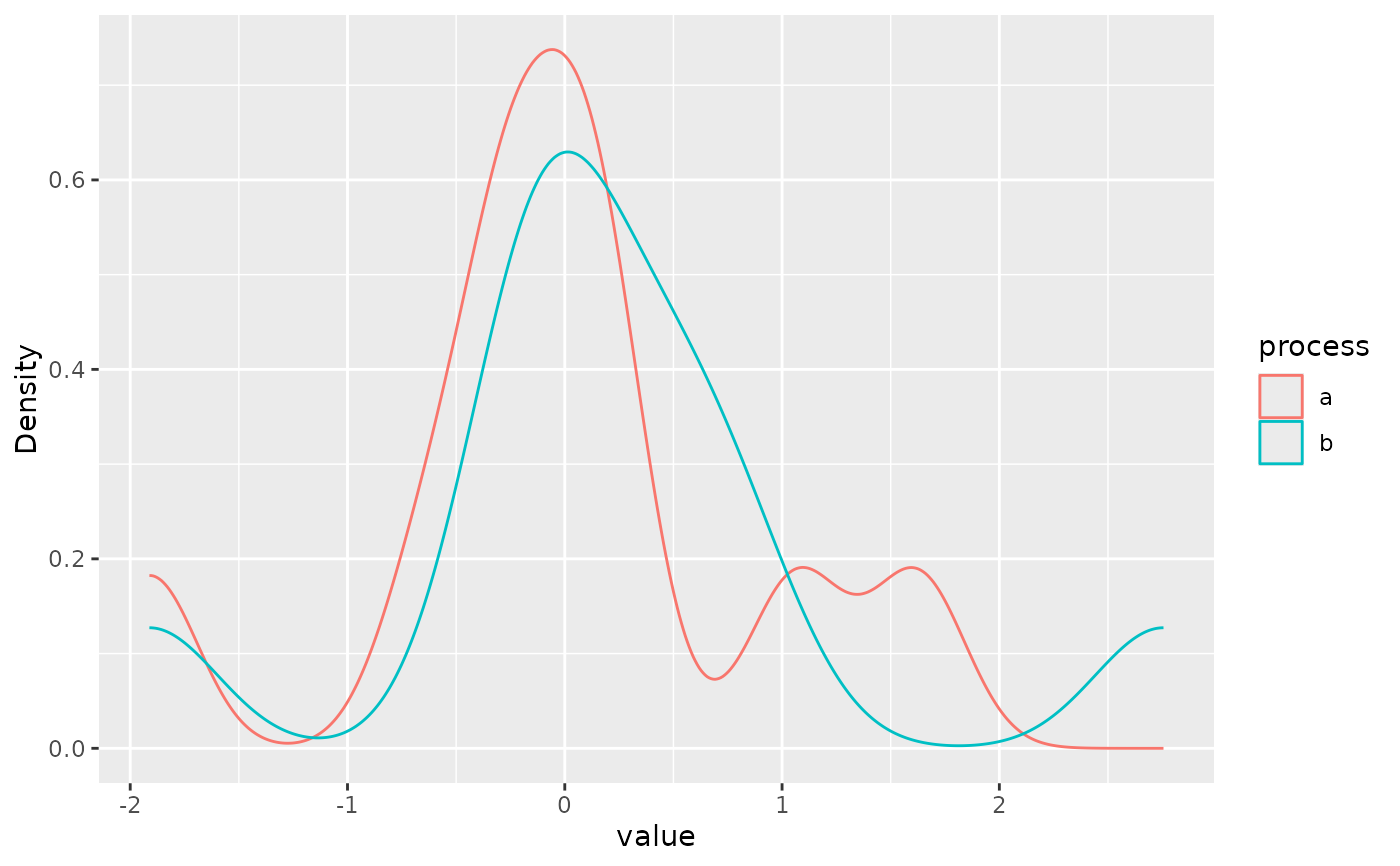
Plots density curves for one or more process-group metrics.
Examples
if (requireNamespace("ggplot2", quietly = TRUE)) {
  df <- data.frame(value = rnorm(20), process = rep(c("a", "b"), each = 10))
  plot_process_density(df, value = "value", group = "process")
}