
Plots a summary column from summarize_terrain() or related functions.
Examples
if (requireNamespace("ggplot2", quietly = TRUE)) {
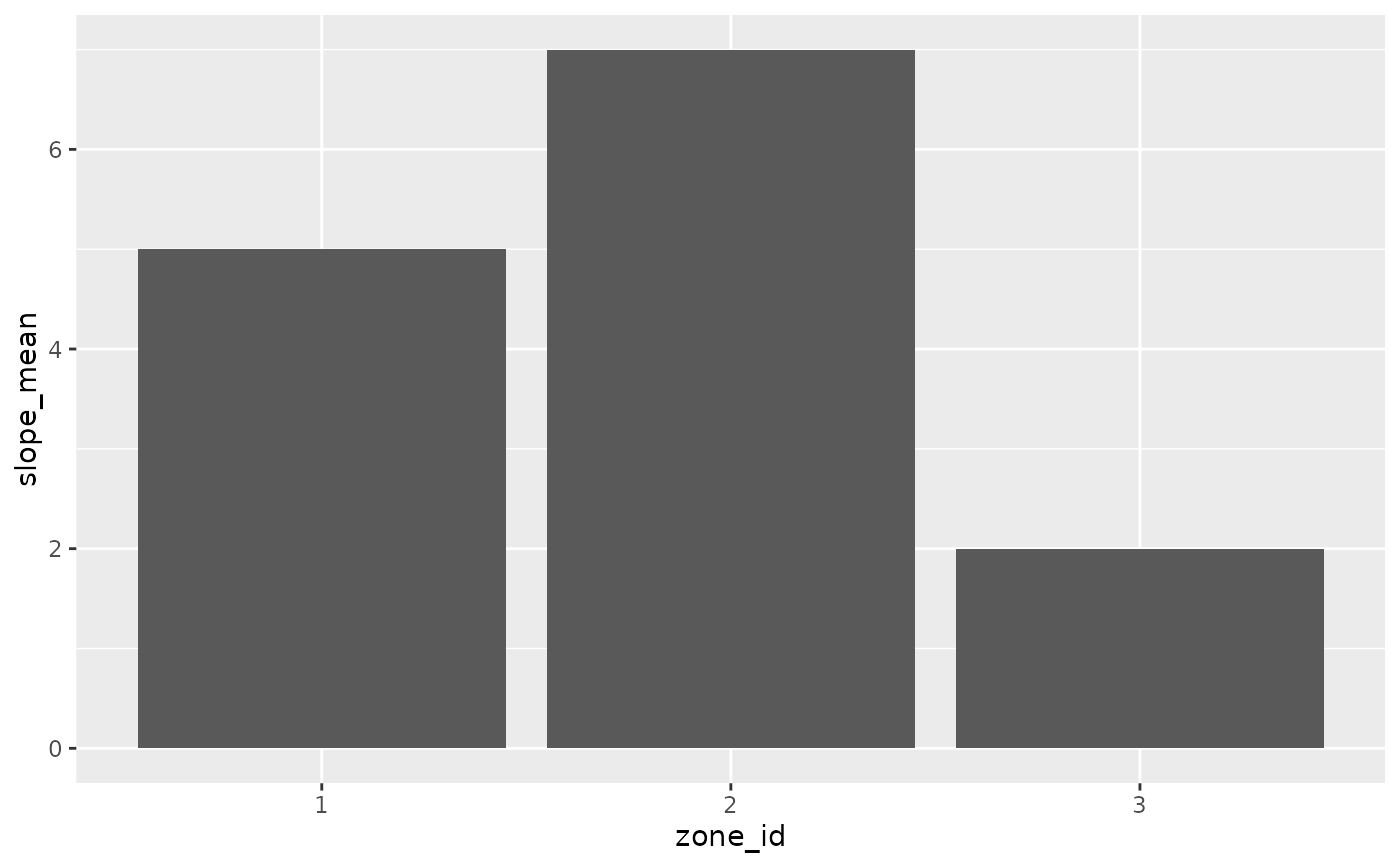
  df <- data.frame(zone_id = 1:3, slope_mean = c(5, 7, 2))
  plot_terrain_summary(df, value = "slope_mean")
}
Plots a summary column from summarize_terrain() or related functions.
if (requireNamespace("ggplot2", quietly = TRUE)) {
df <- data.frame(zone_id = 1:3, slope_mean = c(5, 7, 2))
plot_terrain_summary(df, value = "slope_mean")
}