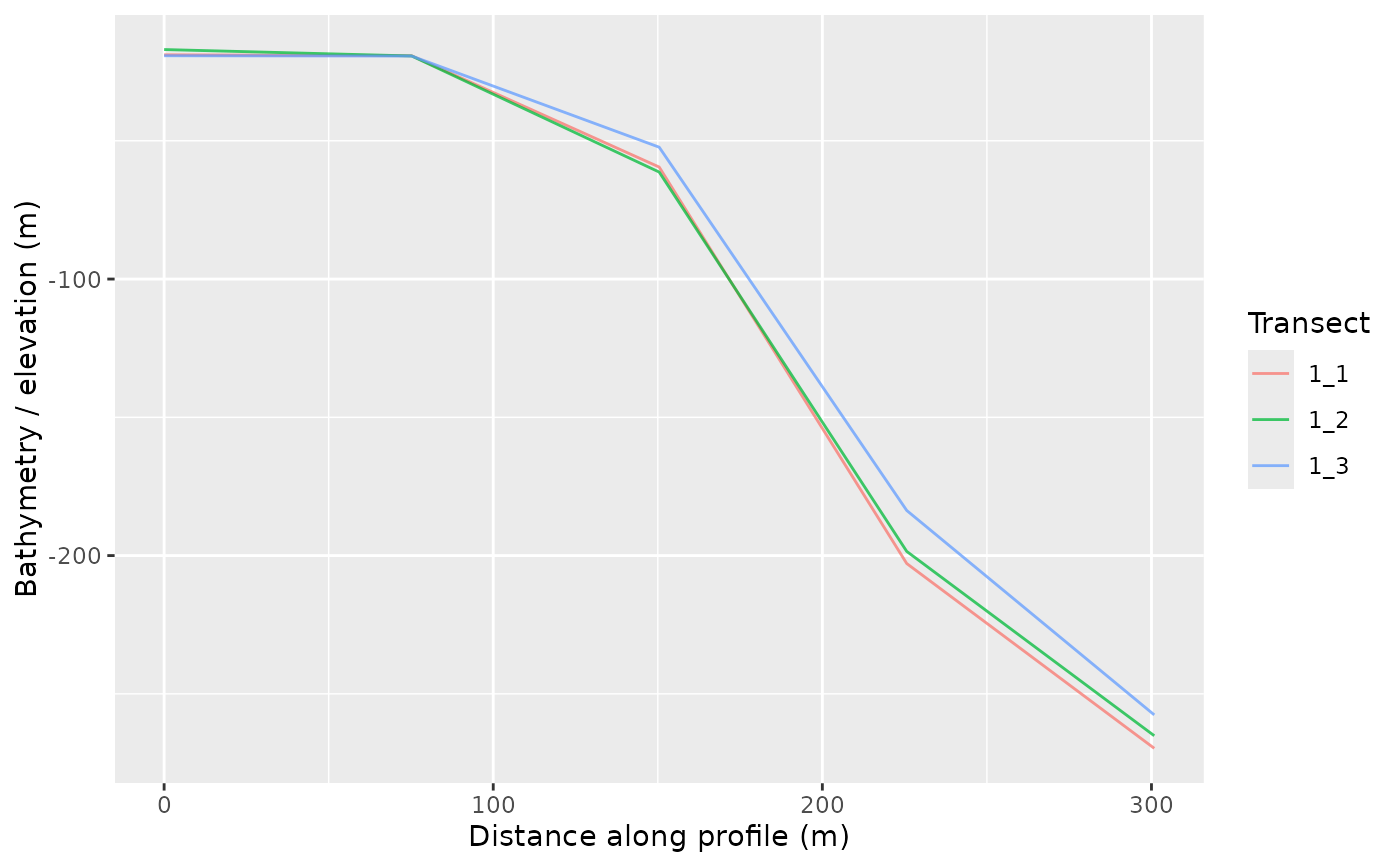
Plots raster values against transect distance.
Usage
plot_cross_sections(
  samples,
  value_col = NULL,
  group_col = "transect_id",
  color_col = NULL,
  show_legend = TRUE,
  points = FALSE,
  mean_profile = FALSE,
  mean_profile_na_rm = TRUE,
  normalize_distance = FALSE,
  profile_direction = c("top_to_bottom", "bottom_to_top", "as_sampled", "max_to_min",
    "min_to_max", "high_to_low", "low_to_high"),
  positive_depth = NULL,
  depth_increases_down = TRUE,
  title = NULL,
  subtitle = NULL,
  caption = NULL
)
Arguments
- samples
Output from
sample_transects().- value_col
Optional value column.
- group_col
Grouping column for transect lines.
- color_col
Optional column used to color profiles. Defaults to
group_col.- show_legend
Logical. Show the line-color legend.
- points
Logical. Draw sample points over profile lines.
- mean_profile
Logical. Overlay an interpolated mean profile across transects.
- mean_profile_na_rm
Logical. Remove missing interpolated profile values when averaging the mean profile. The default,
TRUE, lets the mean profile use the full available distance range rather than stopping where the shortest transect ends. Set toFALSEto require every profile to contribute at each distance.- normalize_distance
Logical. Plot distance as 0-1 normalized position along each transect.
- profile_direction
Direction used to orient distance before plotting.
"top_to_bottom"(the default) orients bathymetric or elevation profiles from the shallow or top endpoint toward the deeper or bottom endpoint. With negative-elevation bathymetry this means higher numeric values to lower numeric values. With positive-depth bathymetry, setpositive_depth = TRUEso the profile runs from lower depth values to higher depth values."bottom_to_top"reverses that convention."max_to_min"and"min_to_max"provide explicit numeric endpoint controls for metrics, and"as_sampled"preserves the sampled line order. Legacy values"high_to_low"and"low_to_high"are accepted as aliases for"top_to_bottom"and"bottom_to_top".- positive_depth
Logical depth convention for
value_col. This affects top-to-bottom profile orientation for depth-like variables and y-axis display for positive-depth values.- depth_increases_down
Logical. If
TRUE, positive-depth profiles are plotted with a reversed y-axis so larger depths appear lower in the panel.- title, subtitle, caption
Plot text.
Examples
if (requireNamespace("ggplot2", quietly = TRUE)) {
  bathy <- read_bathy(blueterra_example("bathy"))
  zones <- terra::vect(blueterra_example("zones"))
  transects <- make_transects(zones[1, ], spacing = 100, bathy = bathy)
  samples <- sample_transects(transects, bathy, n = 5)
  plot_cross_sections(samples)
}