
Hydraulic-gradient arrows
flow-arrows.Rmdps_flow_arrows() derives slope, aspect, gradient
magnitude, sampled points, and line features from the interpolated
raster. Aspect supplies the direction toward decreasing modeled
head.
flow <- ps_flow_arrows(
  surface,
  res_factor = 8,
  scale = 75,
  min_gradient = 1e-5,
  endpoint_action = "shorten"
)
bases <- ps_arrow_vertices(flow$arrows, "first")
tips <- ps_arrow_vertices(flow$arrows, "last")

data.frame(
  product = c("gradient raster", "sample points", "arrow lines", "arrow bases", "arrow tips"),
  layers_or_features = c(nlyr(flow$raster), nrow(flow$points), nrow(flow$arrows), nrow(bases), nrow(tips))
)
#>           product layers_or_features
#> 1 gradient raster                  3
#> 2   sample points                 54
#> 3     arrow lines                 54
#> 4     arrow bases                 54
#> 5      arrow tips                 54
plot(flow$raster[["igrad"]], col = hcl.colors(64, "YlOrRd"),
     main = "Hydraulic-gradient magnitude")
plot(contours, add = TRUE, col = "#52646d", lwd = .8)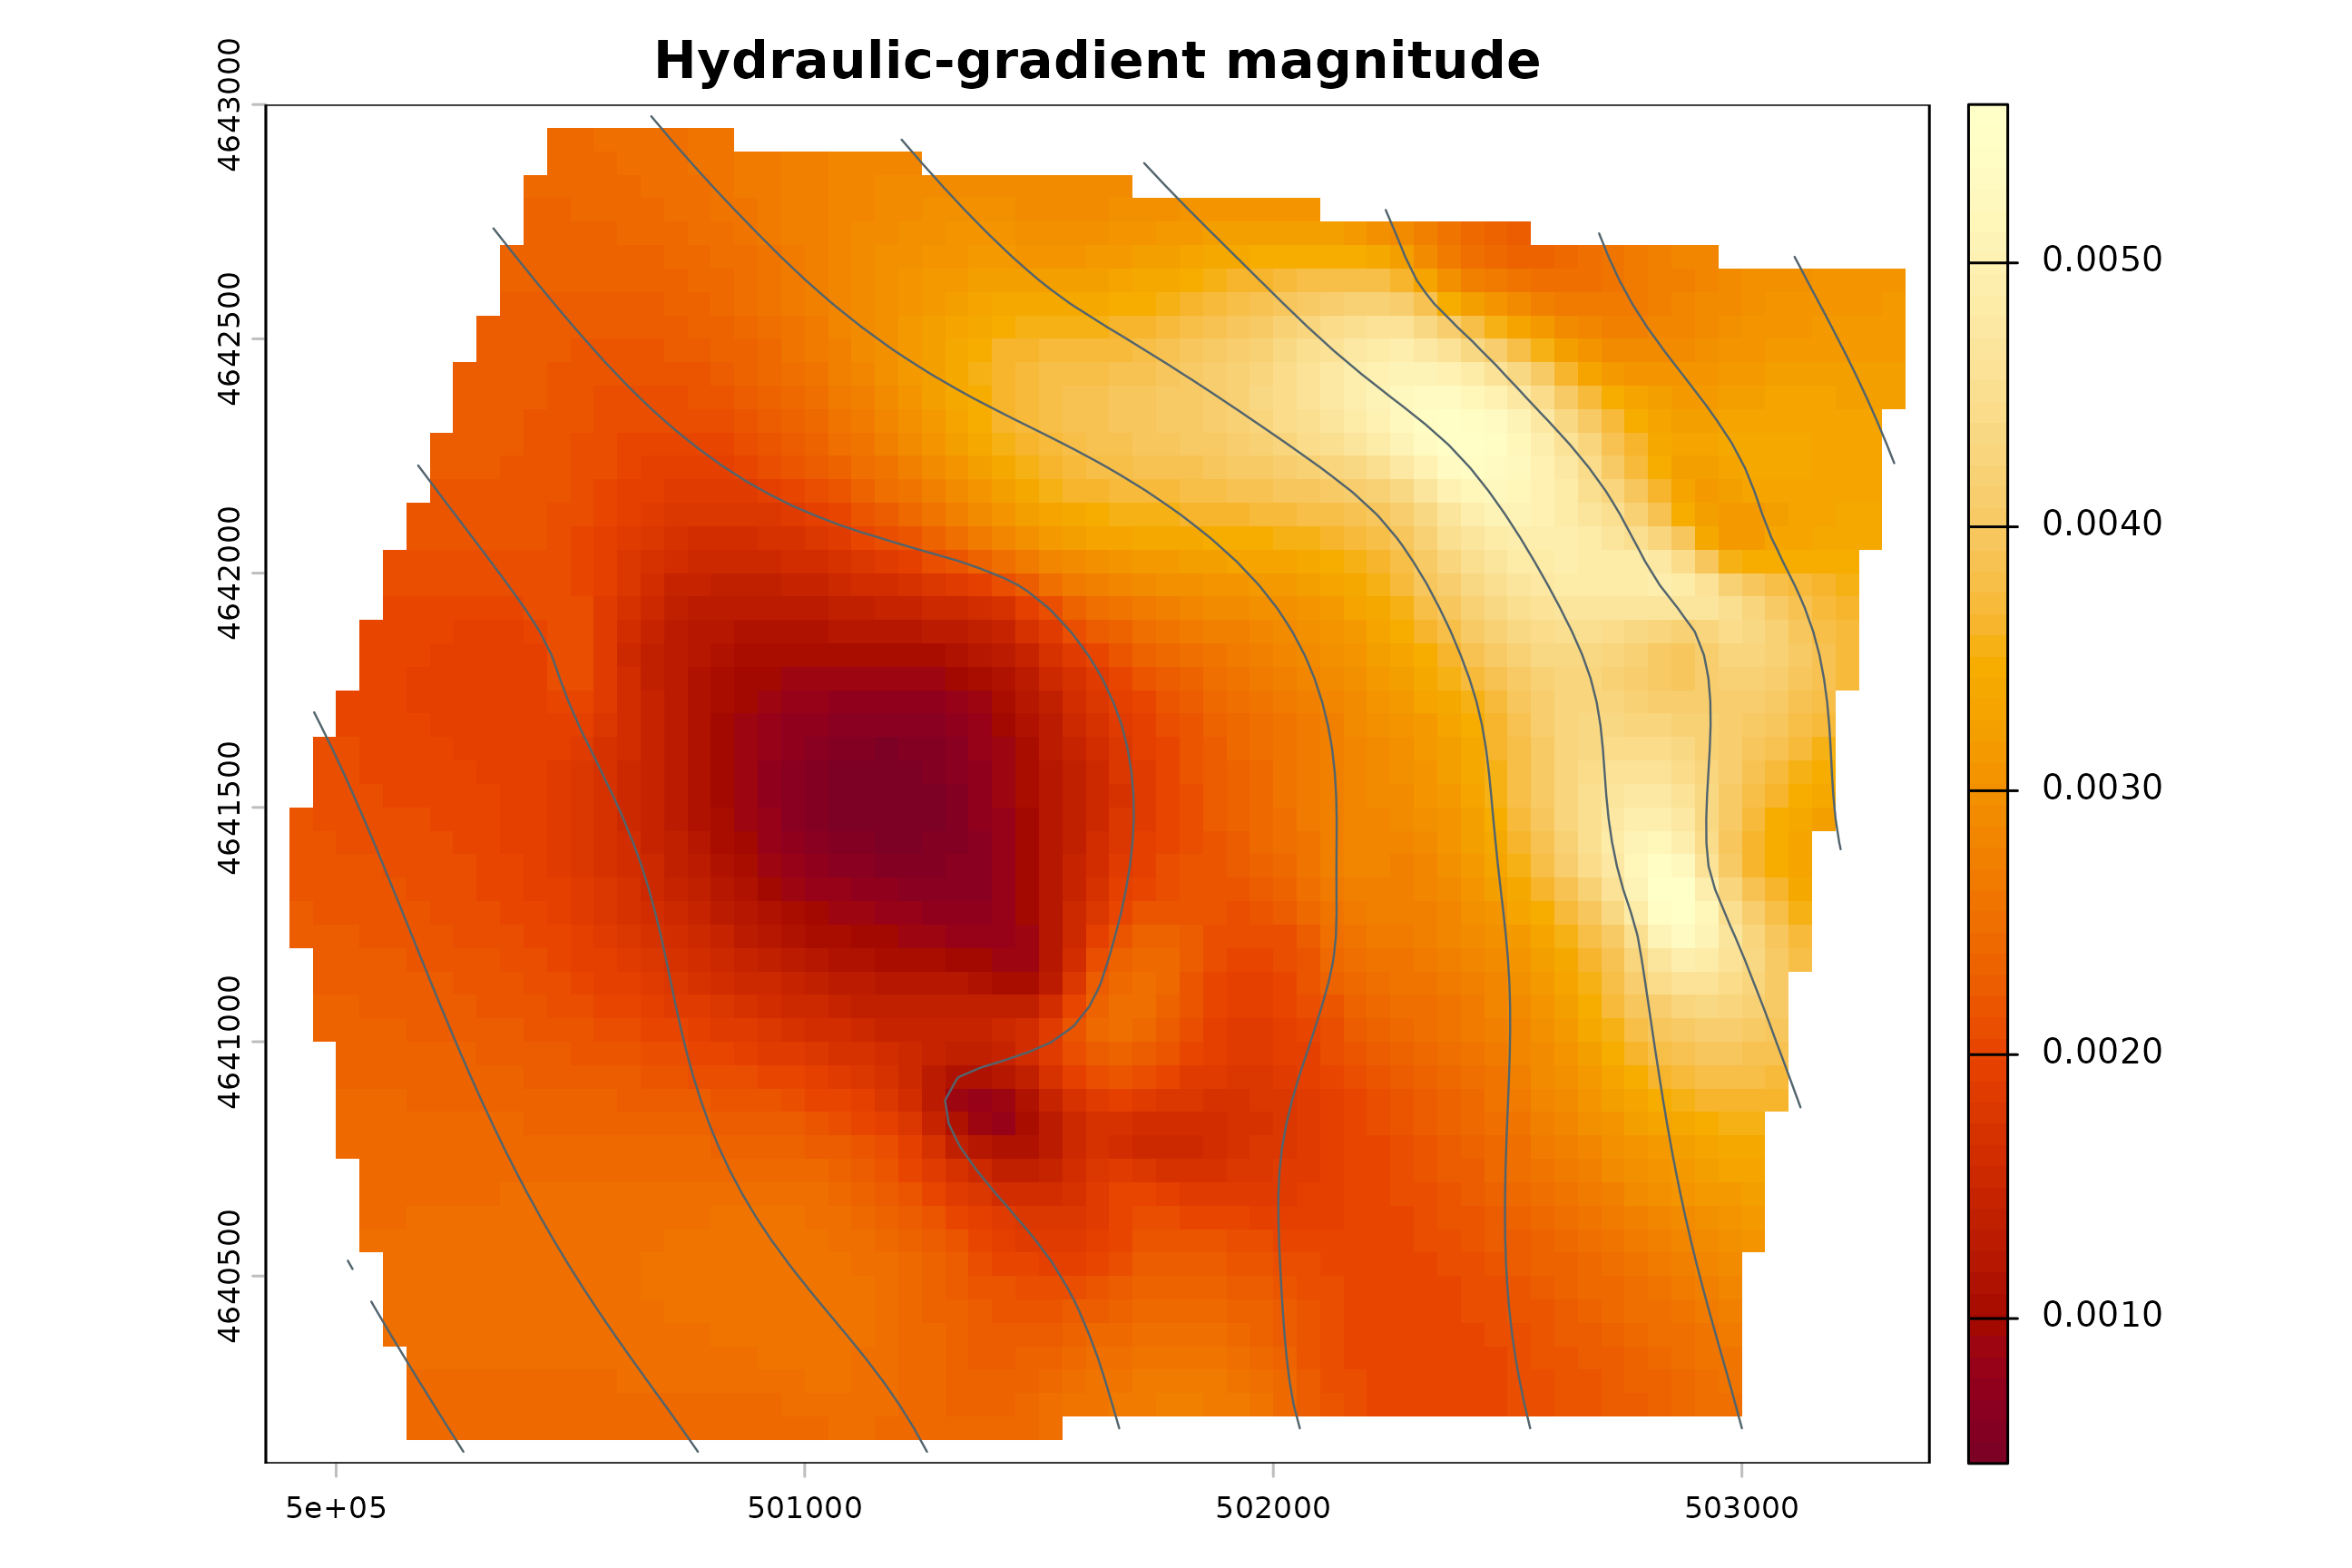
plot(surface, col = cols, main = "Inferred hydraulic-gradient direction")
plot(contours, add = TRUE, col = "#52646d")
draw_lines(flow$arrows)
plot(bases, add = TRUE, pch = 22, bg = "#6ab7cf", cex = .6)
plot(tips, add = TRUE, pch = 21, bg = "#f08a5d", cex = .6)
legend("bottomleft", c("base", "tip"), pch = c(22, 21),
       pt.bg = c("#6ab7cf", "#f08a5d"), bty = "n")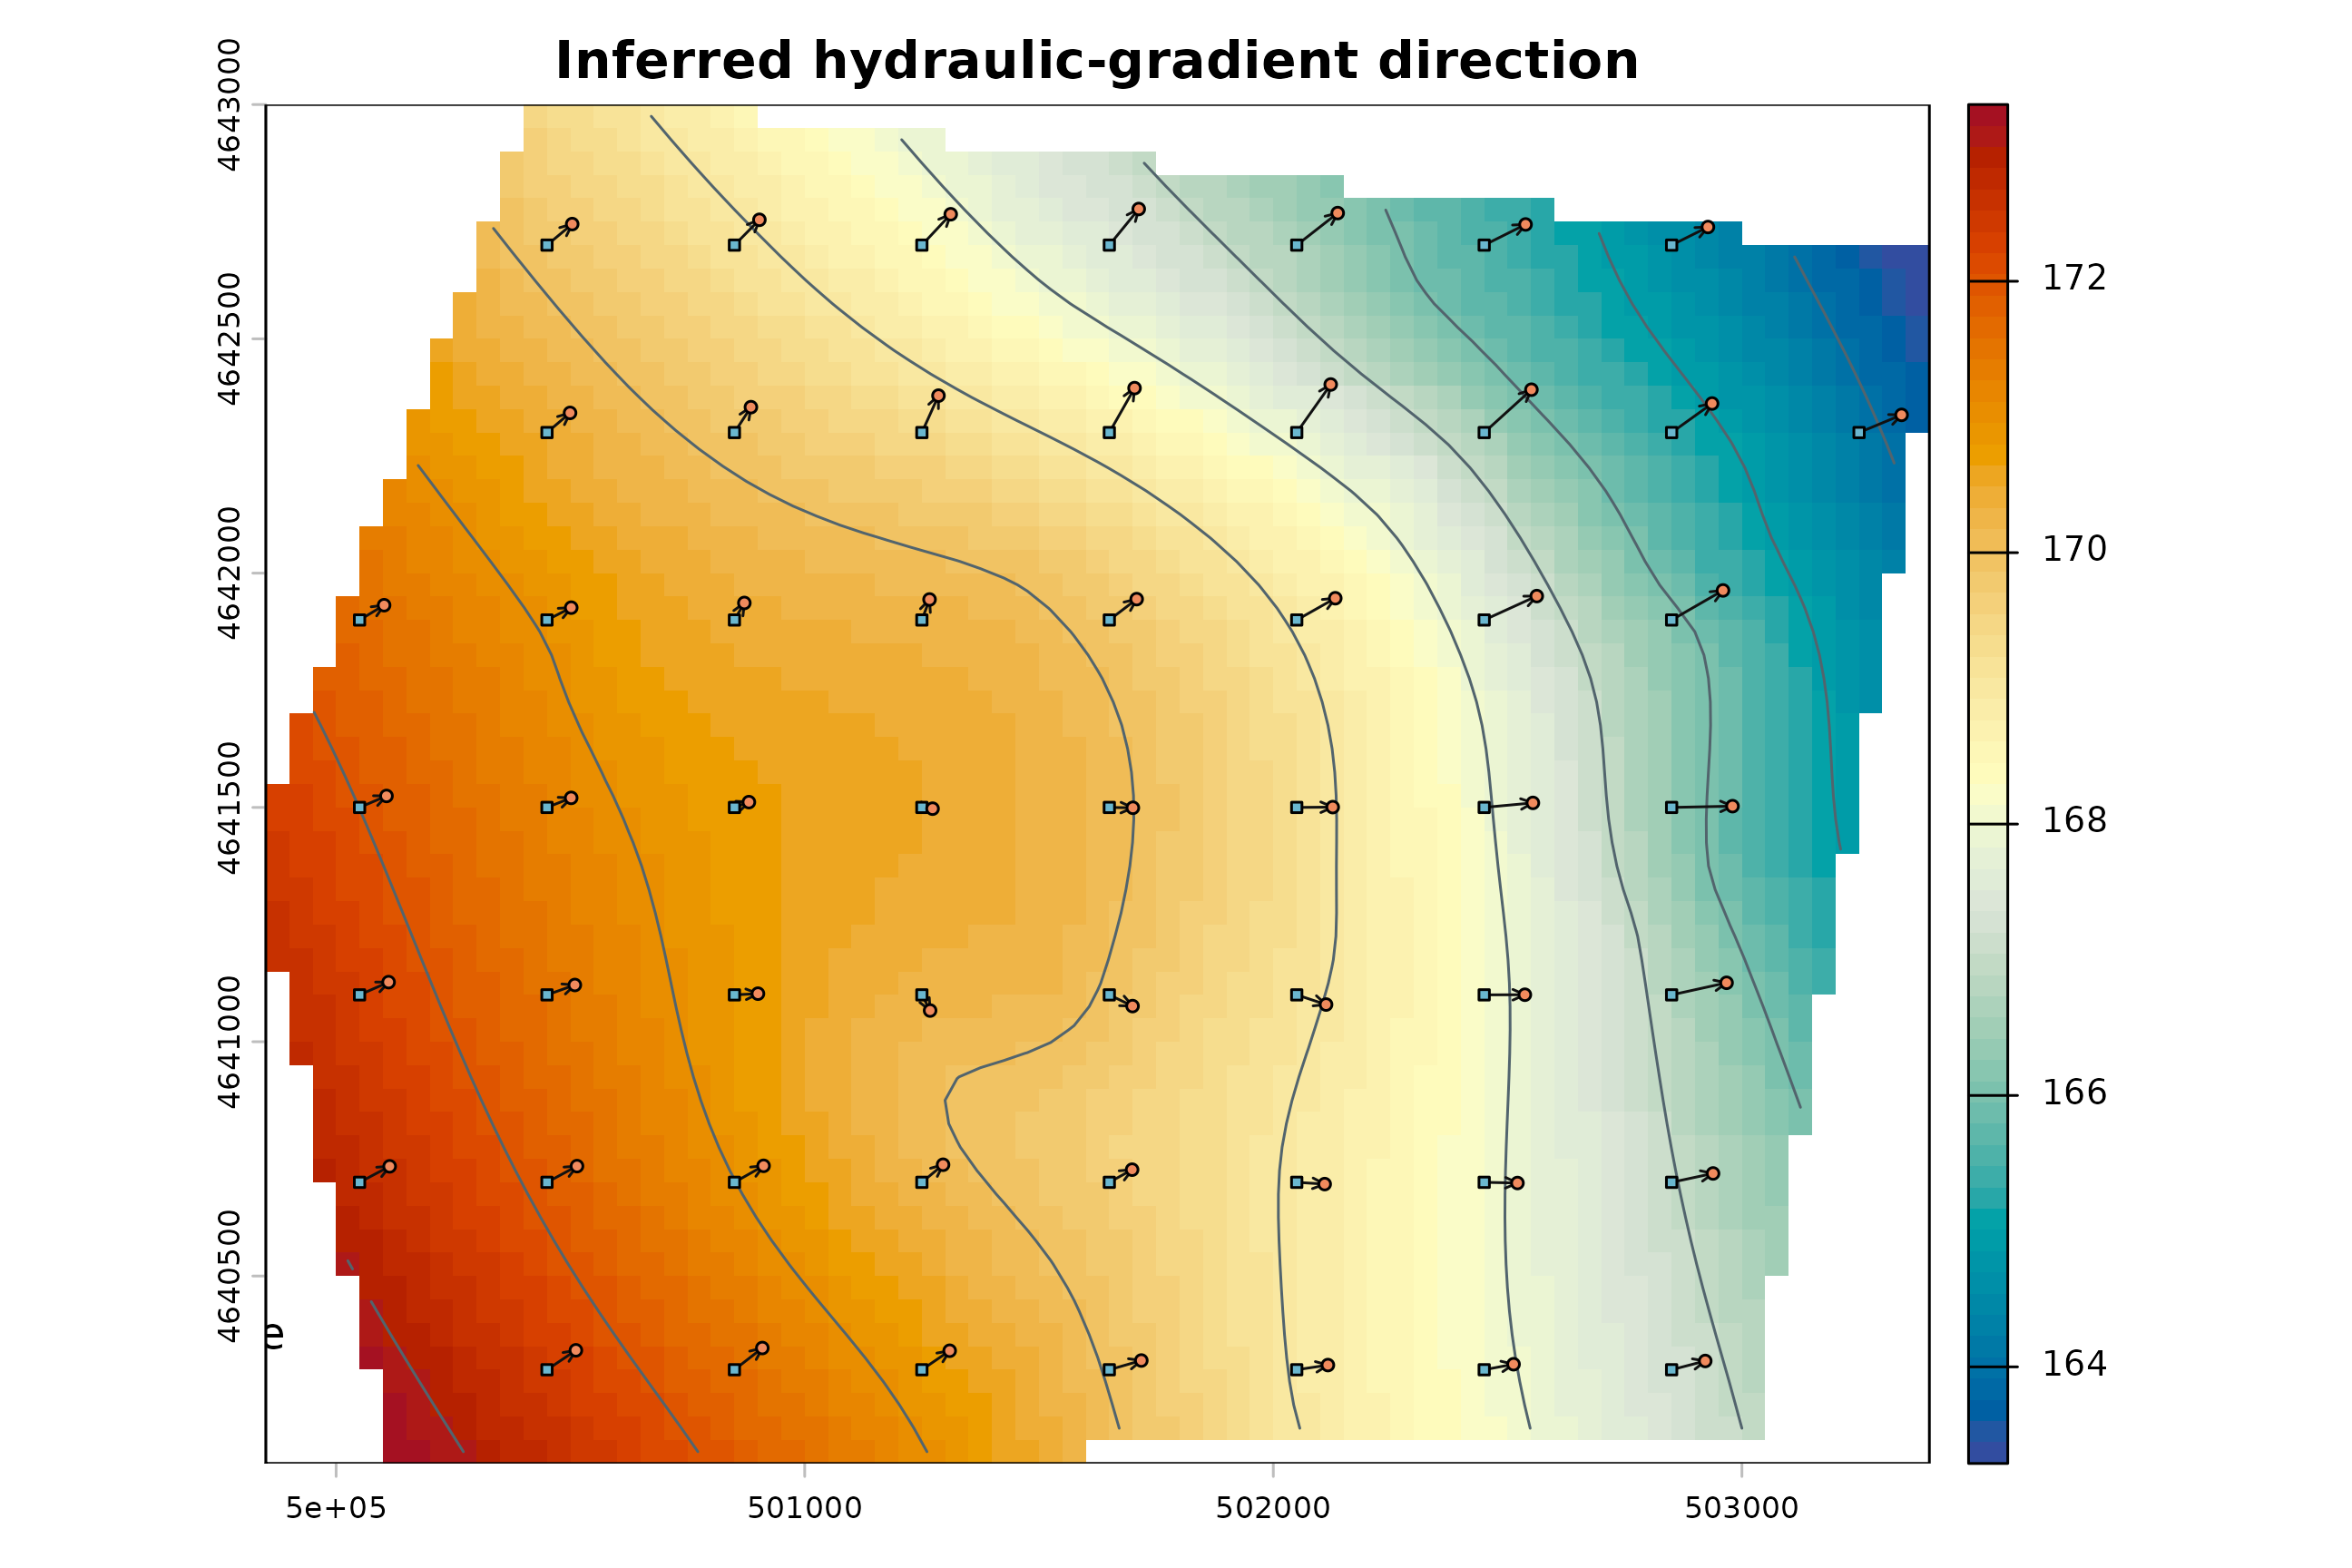
Verify that sampled tips are downgradient
The check samples the modeled head at every base and tip. Tips outside the masked raster are reported and excluded. A 0.01-head-unit tolerance addresses raster sampling and the released synthetic data precision; it does not excuse a systematic uphill direction.
base_head <- extract(surface, bases)[, 2]
tip_head <- extract(surface, tips)[, 2]
direction_check <- data.frame(
  arrow_id = seq_len(nrow(flow$arrows)),
  base_head = base_head,
  tip_head = tip_head,
  head_difference = tip_head - base_head
)
tolerance <- 0.01
direction_check$pass <- with(
  direction_check,
  is.finite(base_head) & is.finite(tip_head) & tip_head <= base_head + tolerance
)
sampled <- is.finite(direction_check$base_head) & is.finite(direction_check$tip_head)
pass_rate <- mean(direction_check$pass[sampled])
stopifnot(pass_rate >= 0.95)

head(direction_check, 10)
#>    arrow_id base_head tip_head head_difference pass
#> 1         1  169.8349 169.6697     -0.16520099 TRUE
#> 2         2  169.1352 168.8598     -0.27535914 TRUE
#> 3         3  168.3560 168.0353     -0.32064629 TRUE
#> 4         4  167.5321 167.2009     -0.33121867 TRUE
#> 5         5  166.6015 166.2855     -0.31606379 TRUE
#> 6         6  165.5281 165.3767     -0.15138375 TRUE
#> 7         7  164.6123 164.4228     -0.18952757 TRUE
#> 8         8  170.4126 170.3419     -0.07068473 TRUE
#> 9         9  169.8652 169.6852     -0.18002040 TRUE
#> 10       10  169.4129 169.1302     -0.28267701 TRUE
data.frame(
  arrows = nrow(direction_check),
  sampled_at_base_and_tip = sum(sampled),
  tips_outside_surface = sum(!sampled),
  passes_within_tolerance = sum(direction_check$pass[sampled]),
  pass_rate_percent = round(100 * pass_rate, 1),
  tolerance_head_units = tolerance
)
#>   arrows sampled_at_base_and_tip tips_outside_surface passes_within_tolerance
#> 1     54                      54                    0                      54
#>   pass_rate_percent tolerance_head_units
#> 1               100                 0.01
Density, scale, filtering, and log options
sparse <- ps_flow_arrows(surface, res_factor = 12, scale = 90,
                         min_gradient = 1e-5, endpoint_action = "shorten")
dense <- ps_flow_arrows(surface, res_factor = 5, scale = 60,
                        min_gradient = 1e-5, endpoint_action = "shorten")
filtered <- ps_flow_arrows(surface, res_factor = 8, scale = 75,
                           min_gradient = 0.002, endpoint_action = "shorten")
logged <- ps_flow_arrows(surface, res_factor = 8, scale = 90,
                         min_gradient = 1e-5, log_gradient = TRUE,
                         log_arrow = TRUE, endpoint_action = "shorten")
data.frame(
  setting = c("sparse", "dense", "minimum gradient 0.002", "log gradient and length"),
  lines = c(nrow(sparse$arrows), nrow(dense$arrows), nrow(filtered$arrows), nrow(logged$arrows))
)
#>                   setting lines
#> 1                  sparse    24
#> 2                   dense   133
#> 3  minimum gradient 0.002    45
#> 4 log gradient and length    54
par(mfrow = c(1, 2), mar = c(3, 3, 3, 1))
plot(surface, col = cols, main = "res_factor 12; scale 90")
draw_lines(sparse$arrows, length = .065)
plot(surface, col = cols, main = "res_factor 5; scale 60")
draw_lines(dense$arrows, length = .04)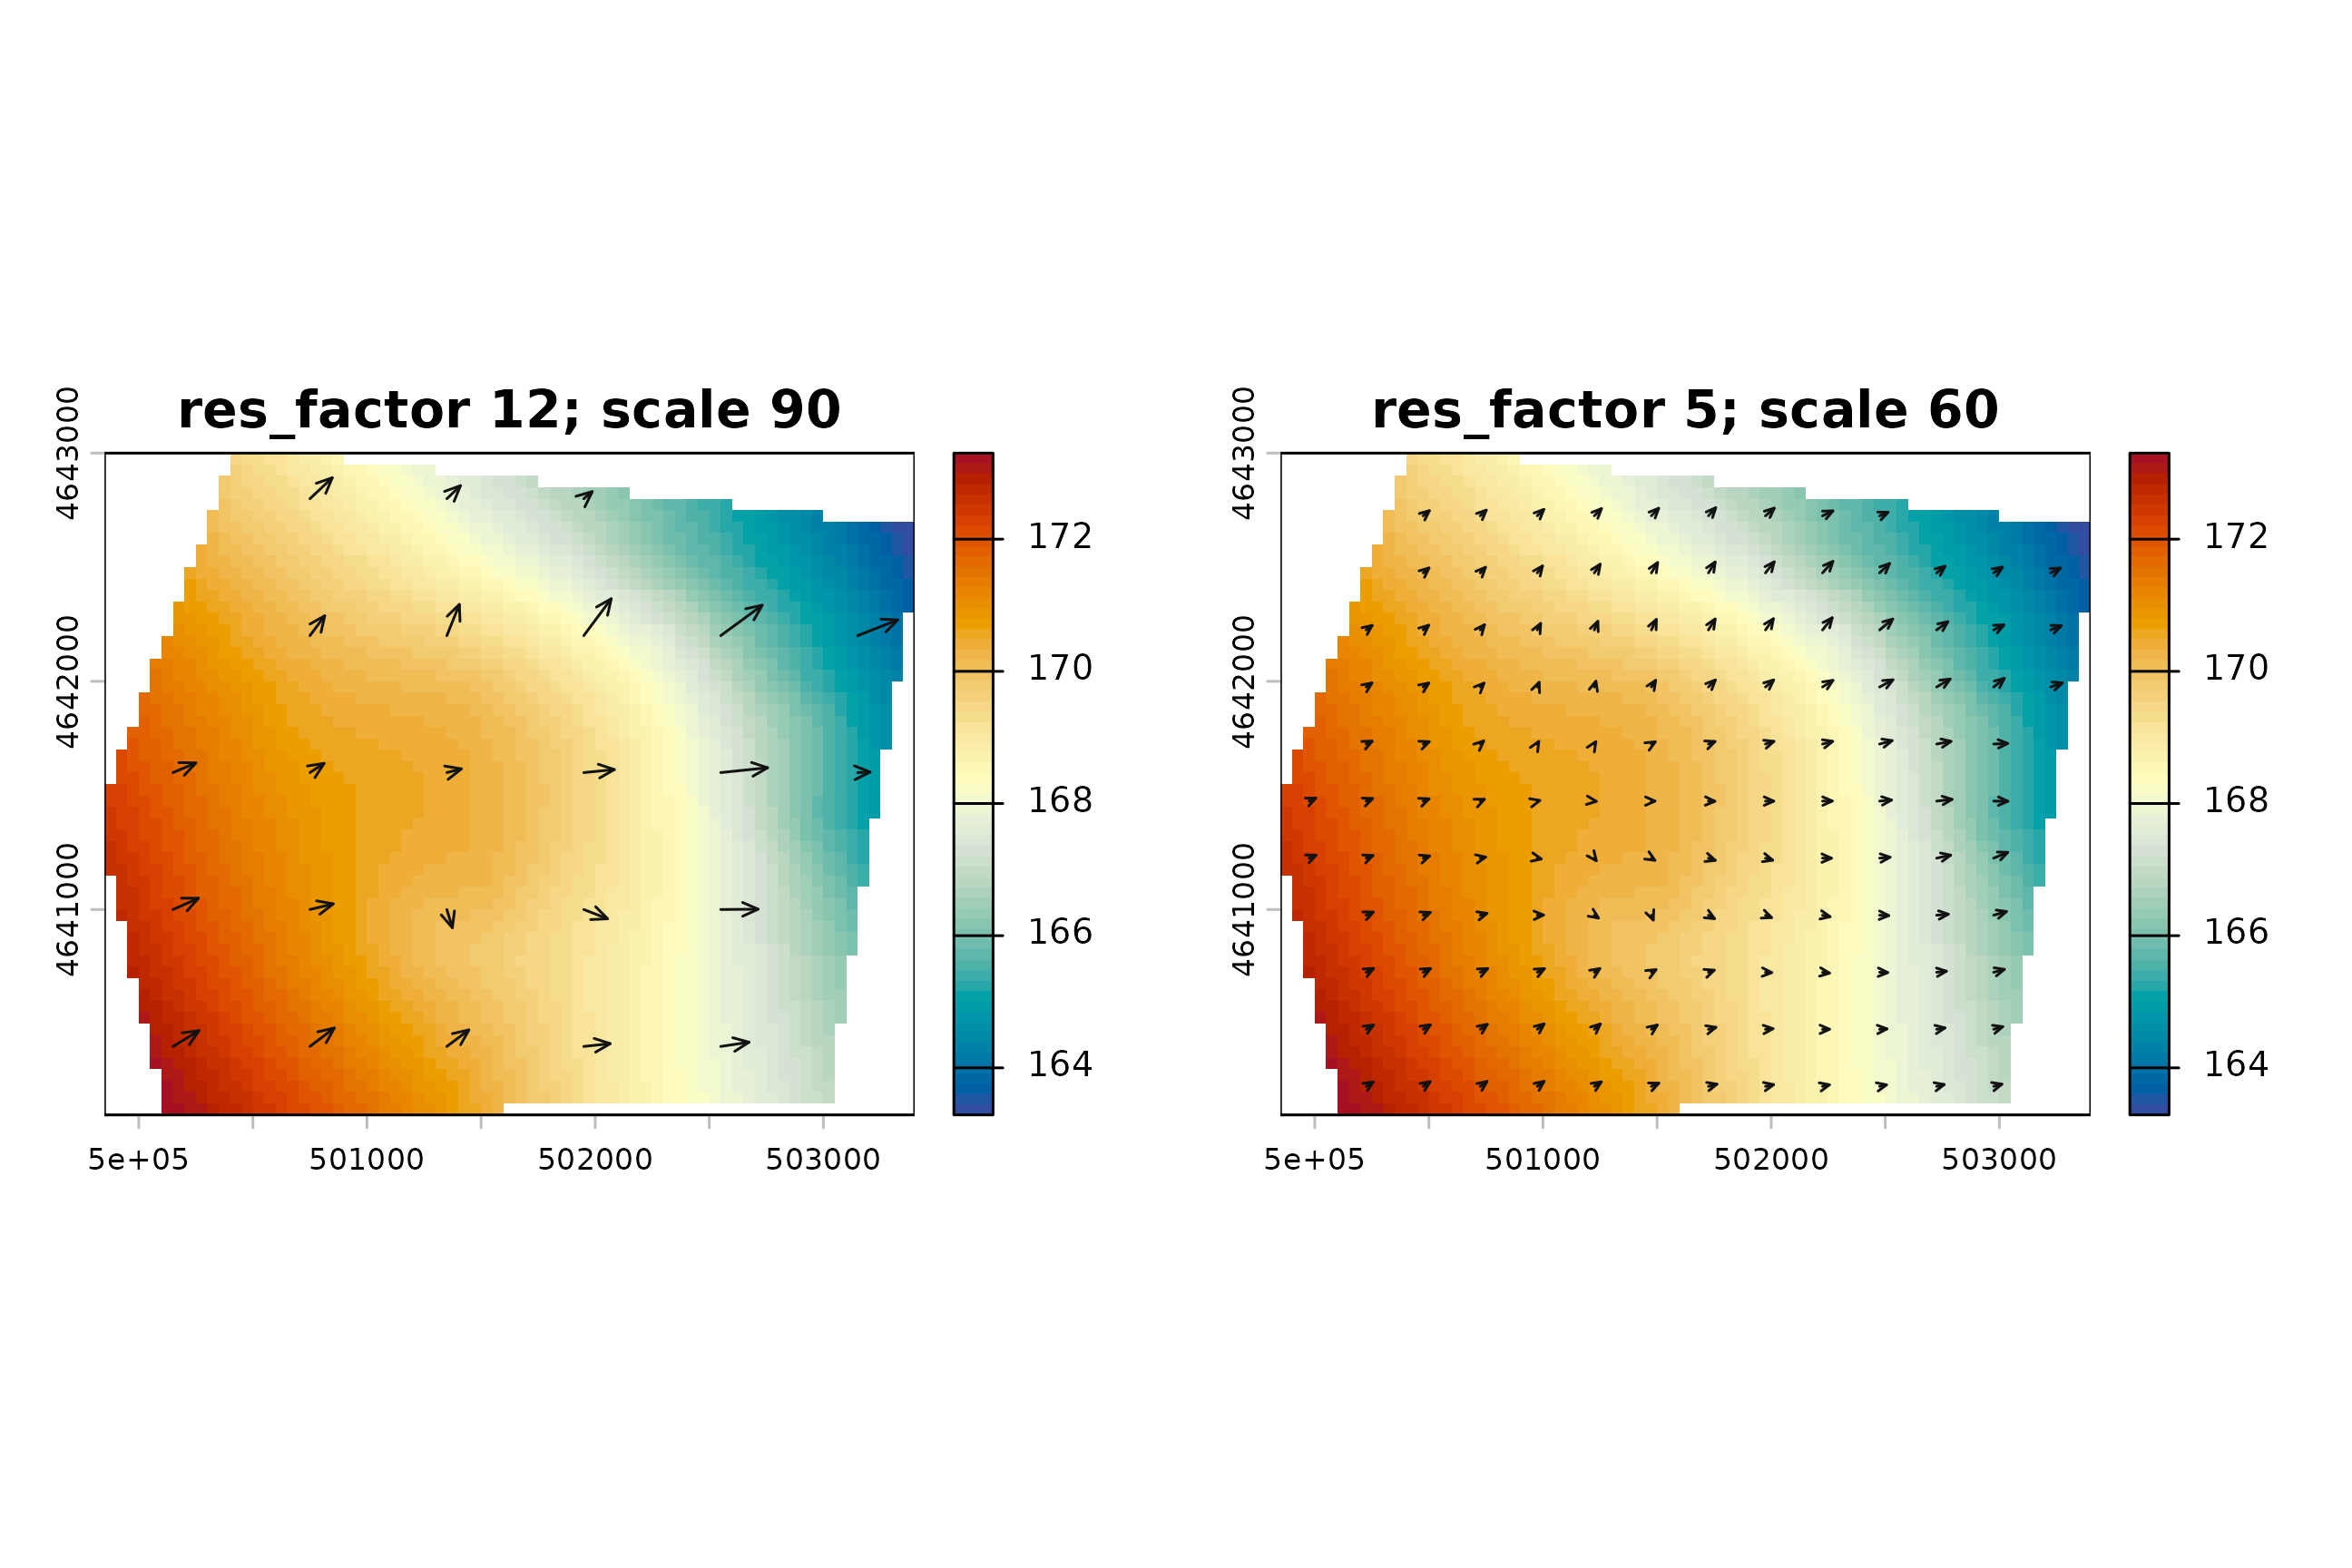
res_factor controls sampling density, not monitoring
density. scale and log_arrow affect
cartographic length. min_gradient can remove flat or nearly
flat areas. Log transformation changes the displayed or stored
magnitude; it does not convert gradient into velocity.
Arrows represent inferred hydraulic-gradient direction from the interpolated surface. Arrow length may be cartographically scaled. They are not groundwater velocities, travel times, particle paths, or contaminant-transport trajectories, and the package is not a process-based groundwater-flow model.