
Output gallery
output-gallery.RmdEvery image below shows an output generated with
potentiomap. Synthetic head values are labeled as synthetic
units and should not be interpreted as field elevations. Warm colors
represent higher modeled head and cool colors represent lower modeled
head; contours, symbols, and arrowheads provide non-color cues.
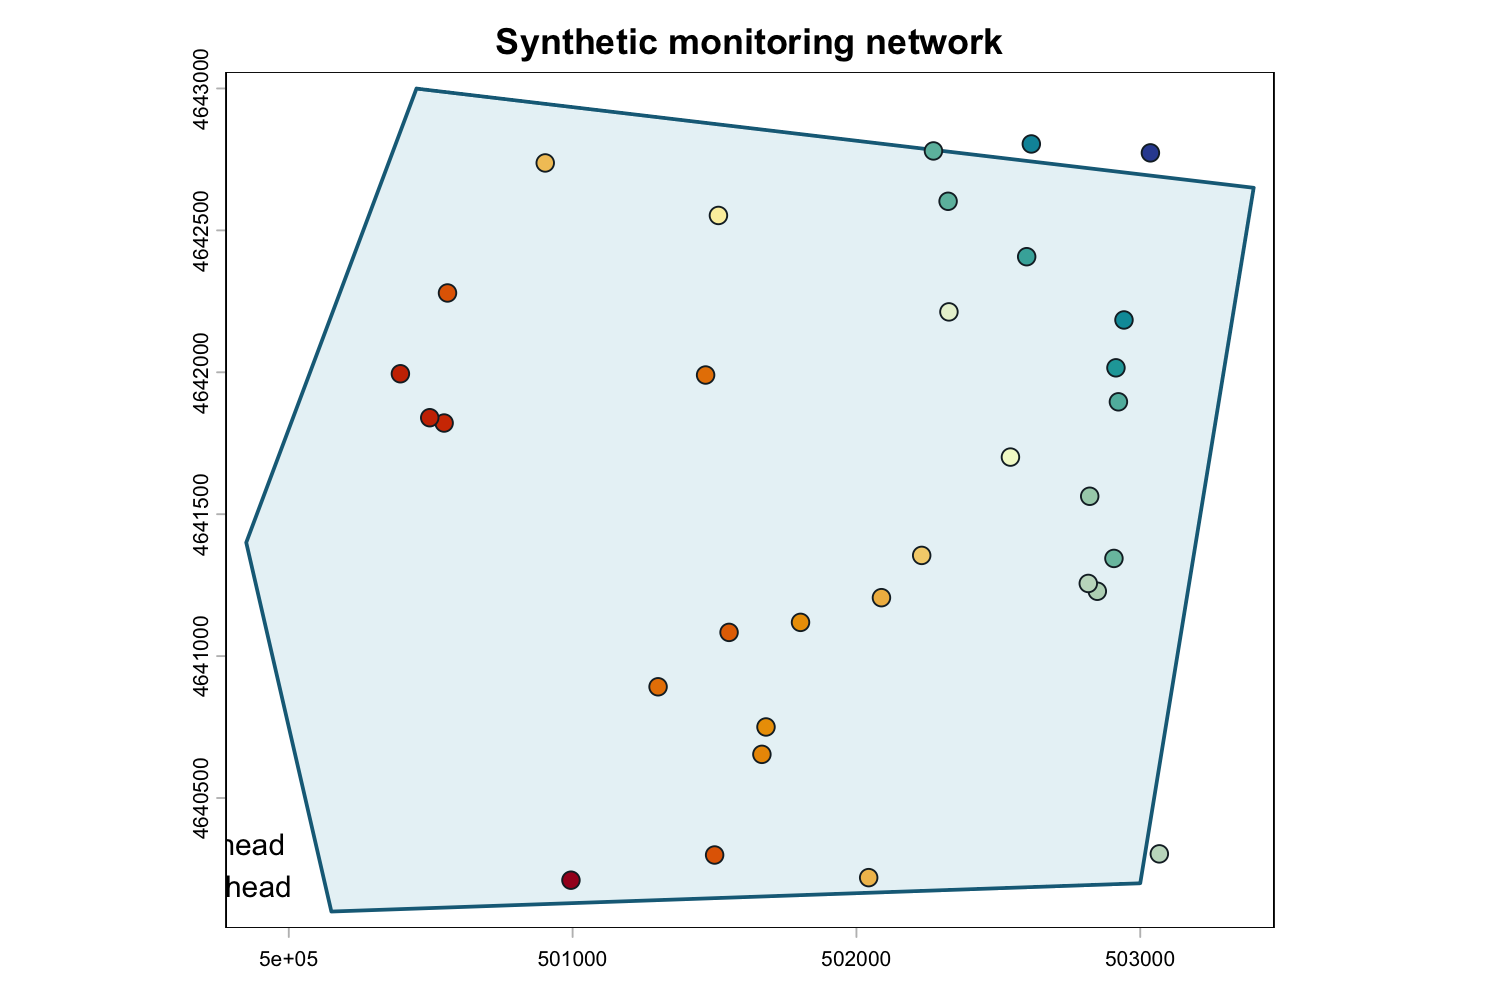
Monitoring network
Method: released synthetic points. Units: UTM metres; synthetic head units. Network geometry conditions every interpolation. Preparation code.
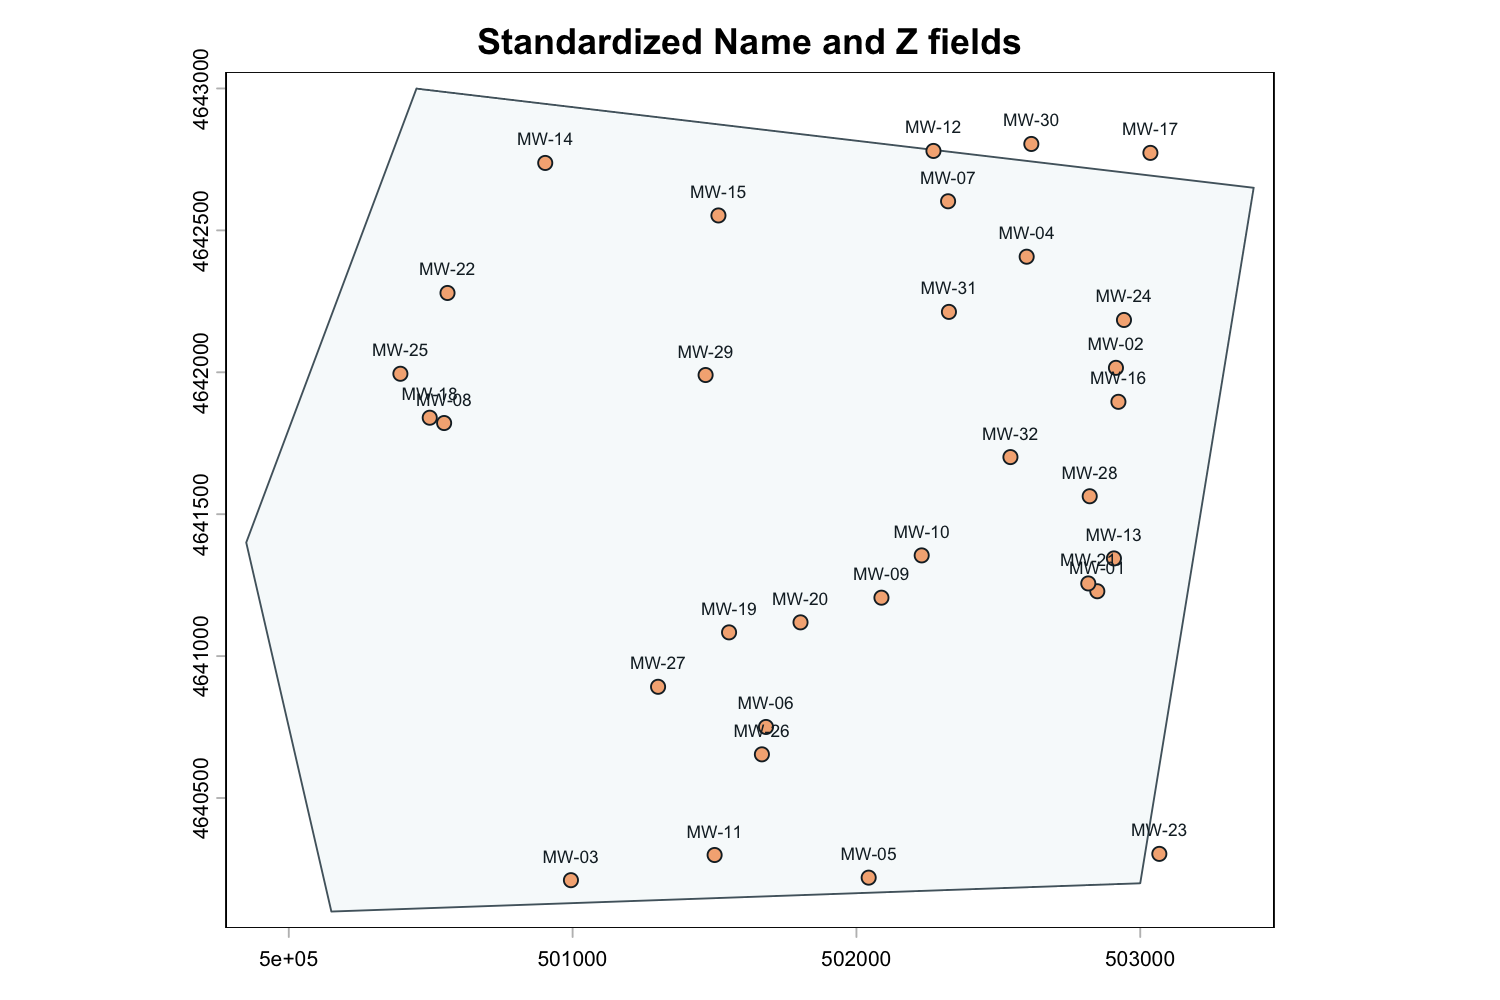
Standardized potentiometric points
Method: ps_make_points().
Units: UTM metres; synthetic head units in
Z. Preparation
pathways.
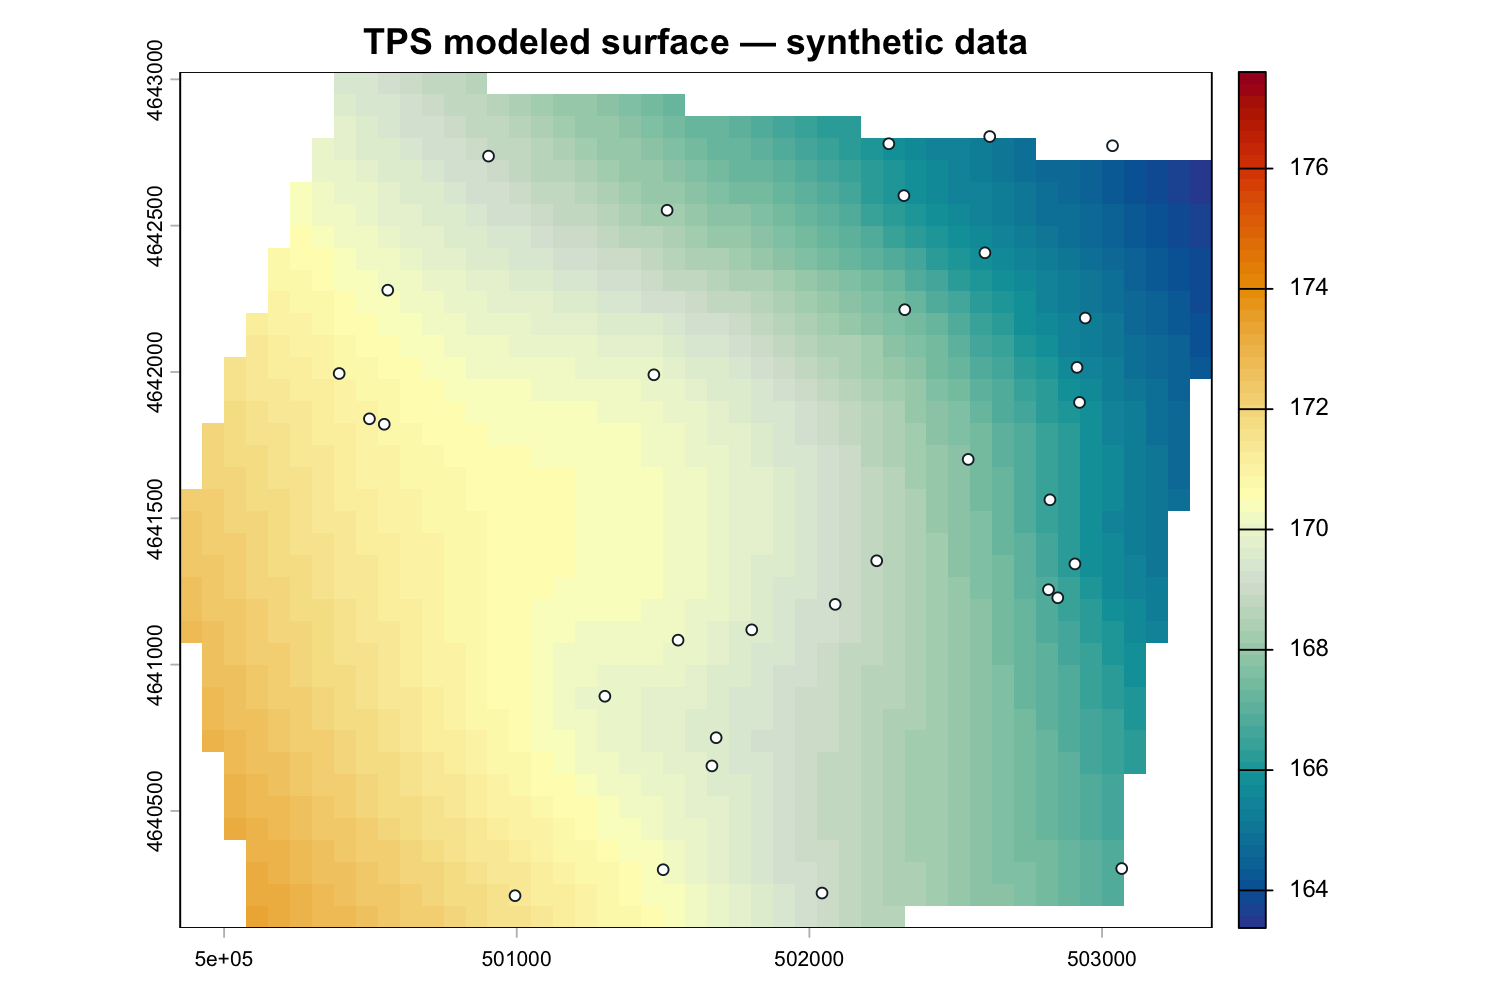
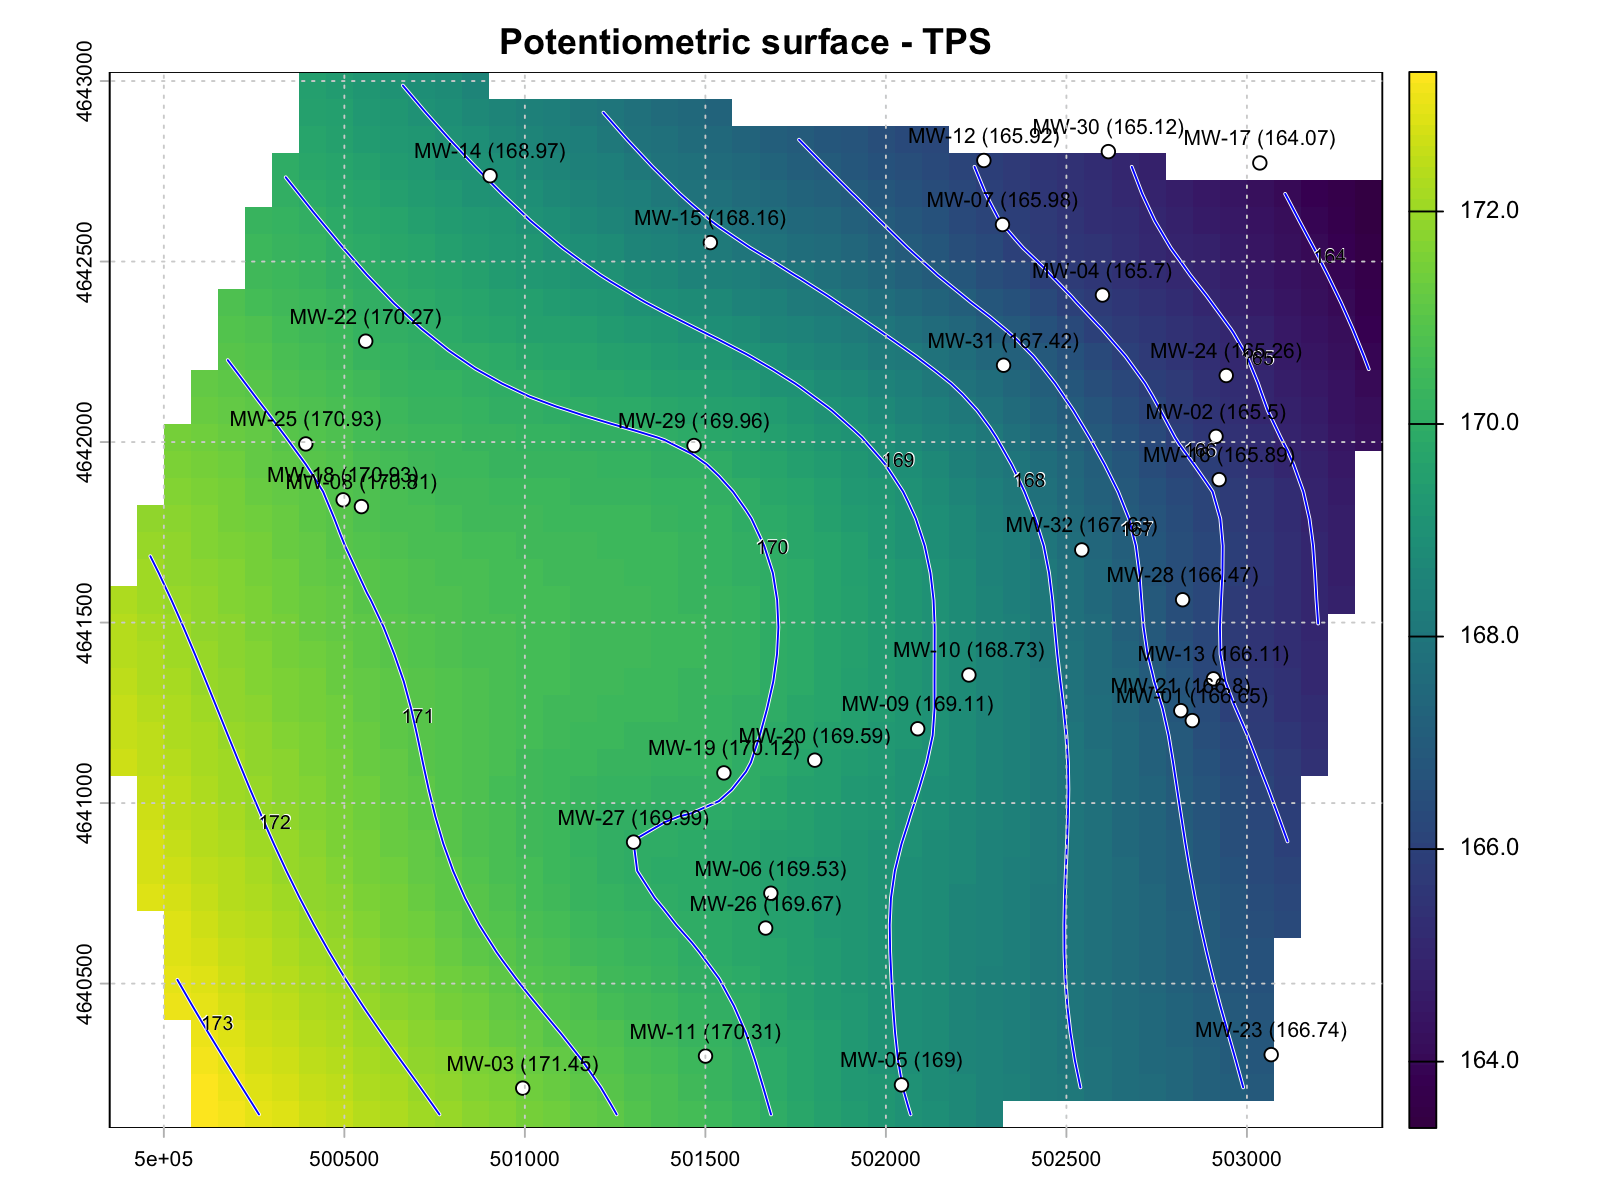
TPS surface
Method: thin-plate spline. Units: synthetic head units; 75-metre cells. Method comparison.
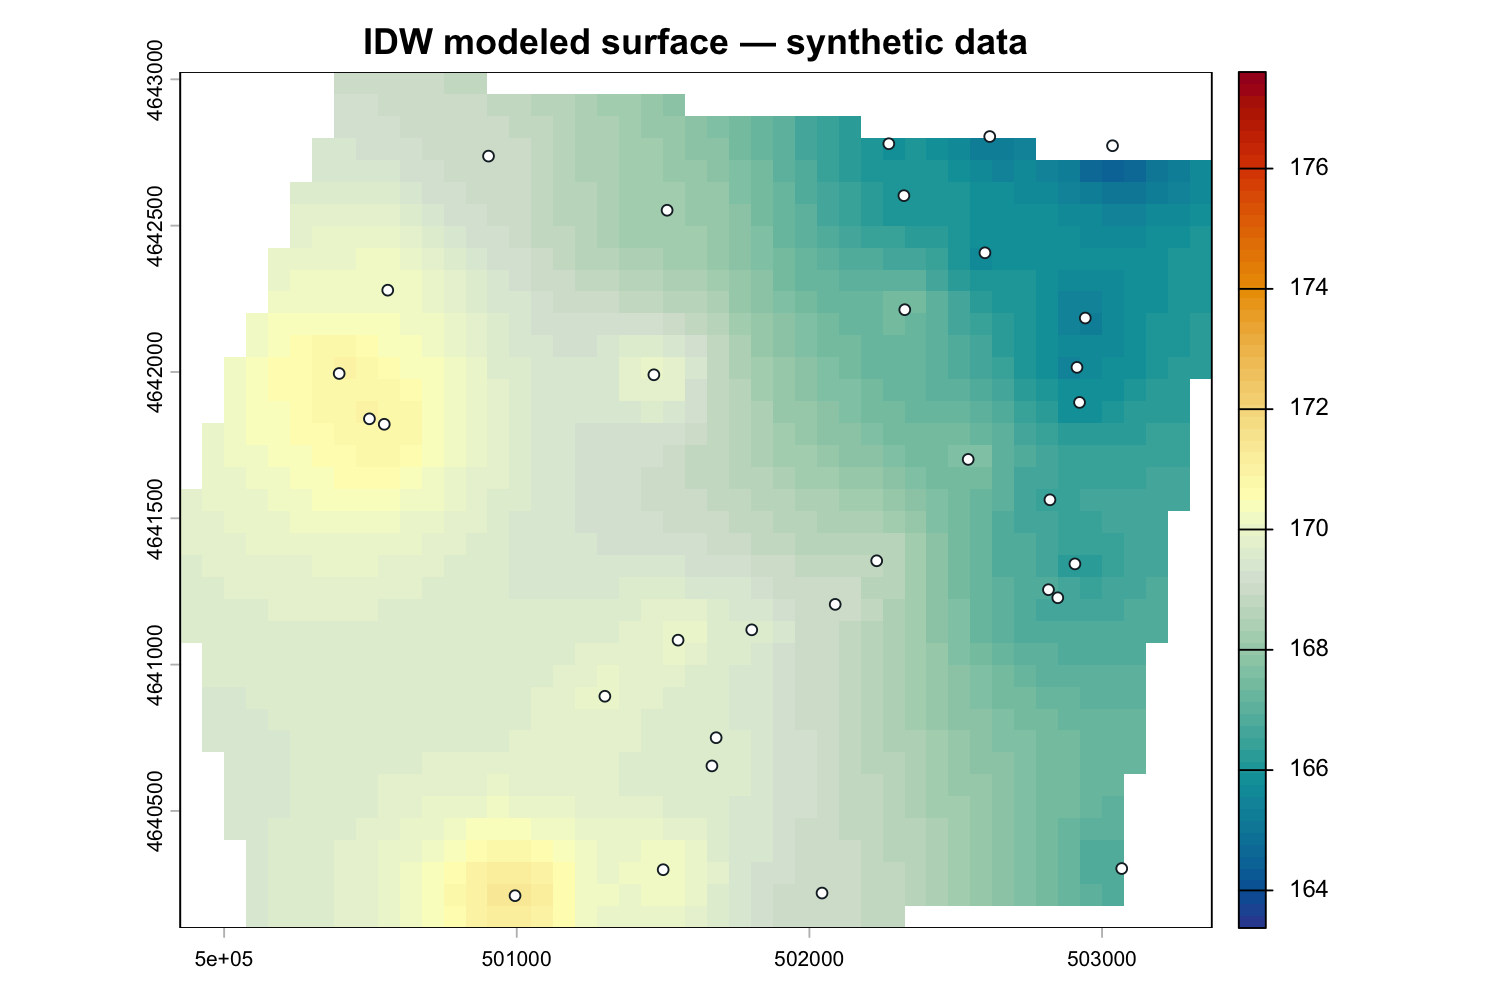
IDW surface
Method: inverse distance weighting. Units: synthetic head units; 75-metre cells. IDW parameters.
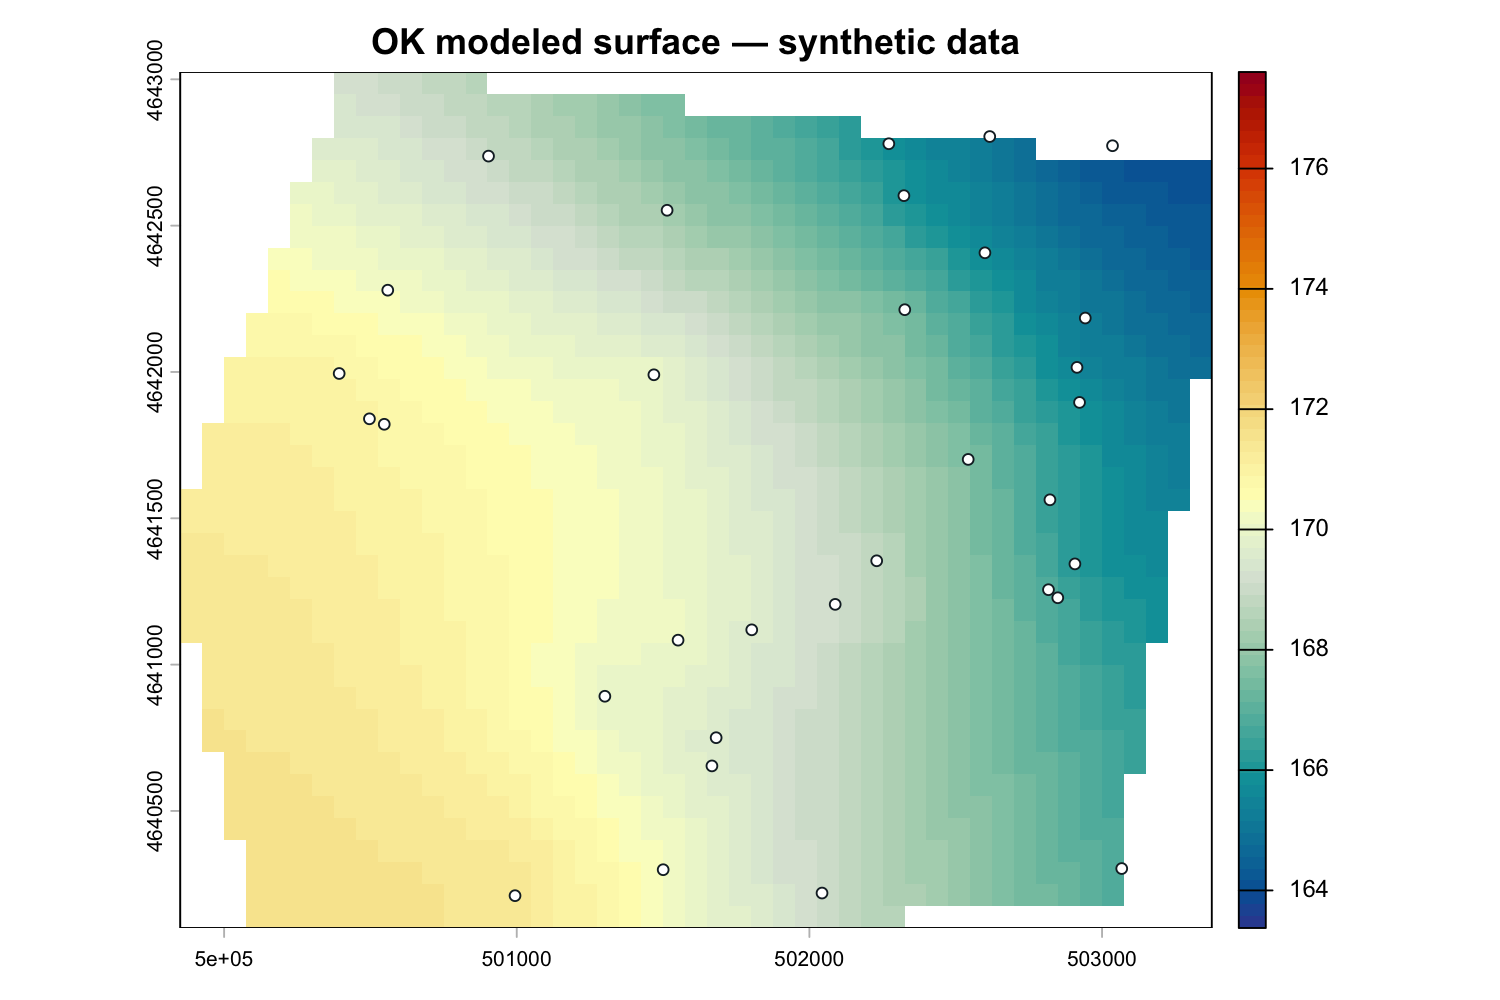
Ordinary-kriging surface
Method: ordinary kriging with the released variogram workflow. Units: synthetic head units; 75-metre cells. Warnings and comparison.
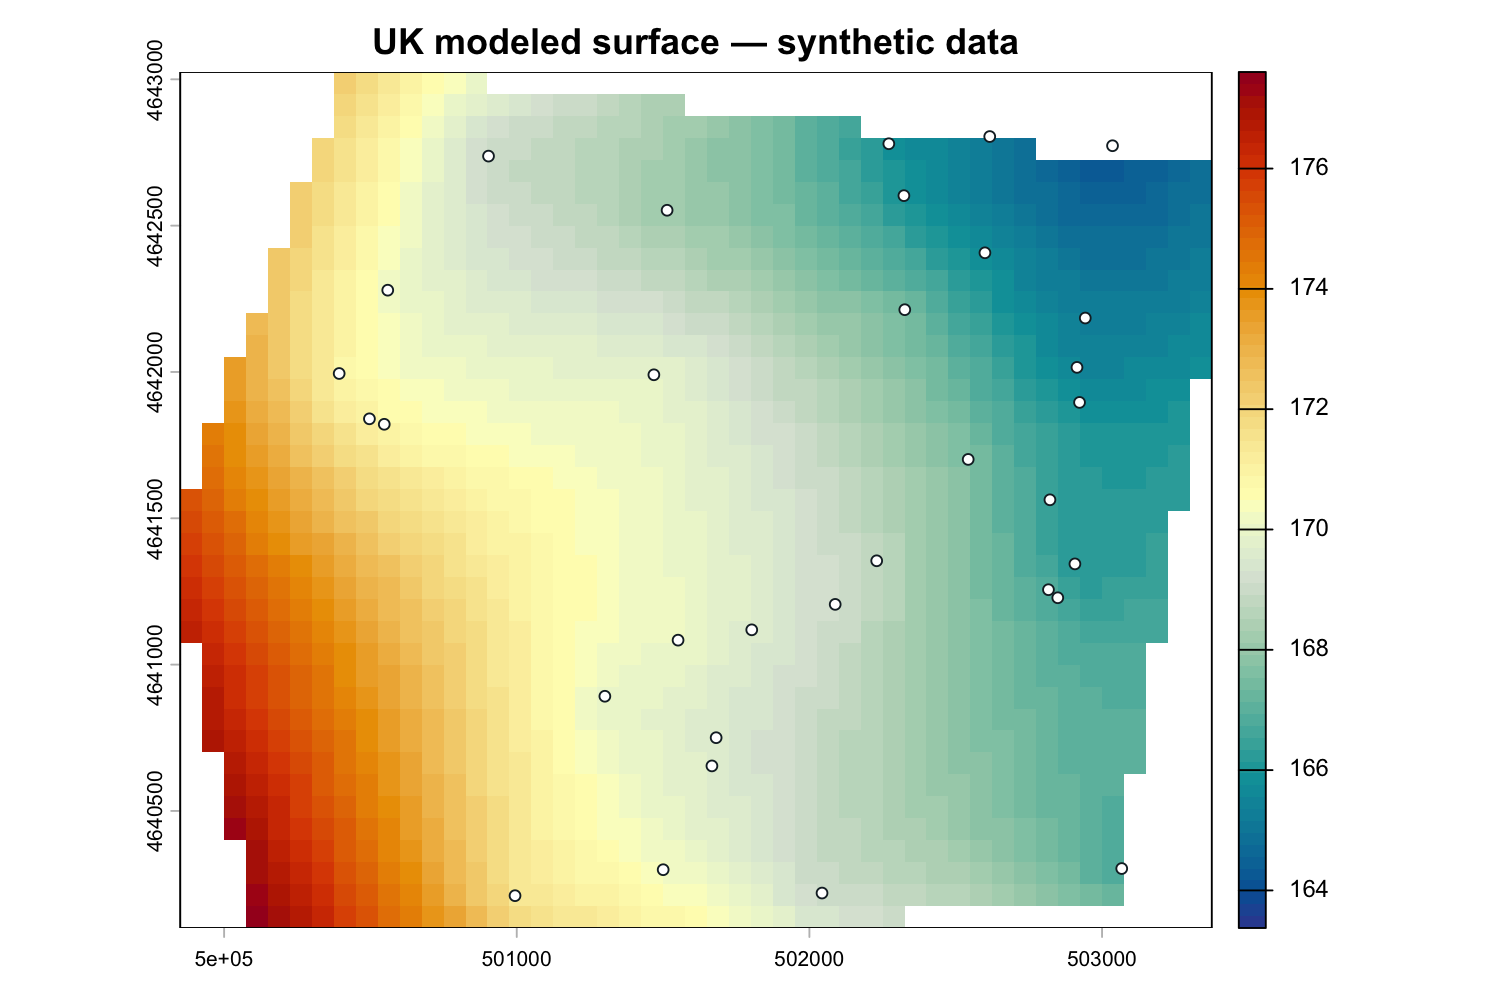
Universal-kriging surface
Method: universal kriging with quadratic drift. Units: synthetic head units; 75-metre cells. Warnings and comparison.
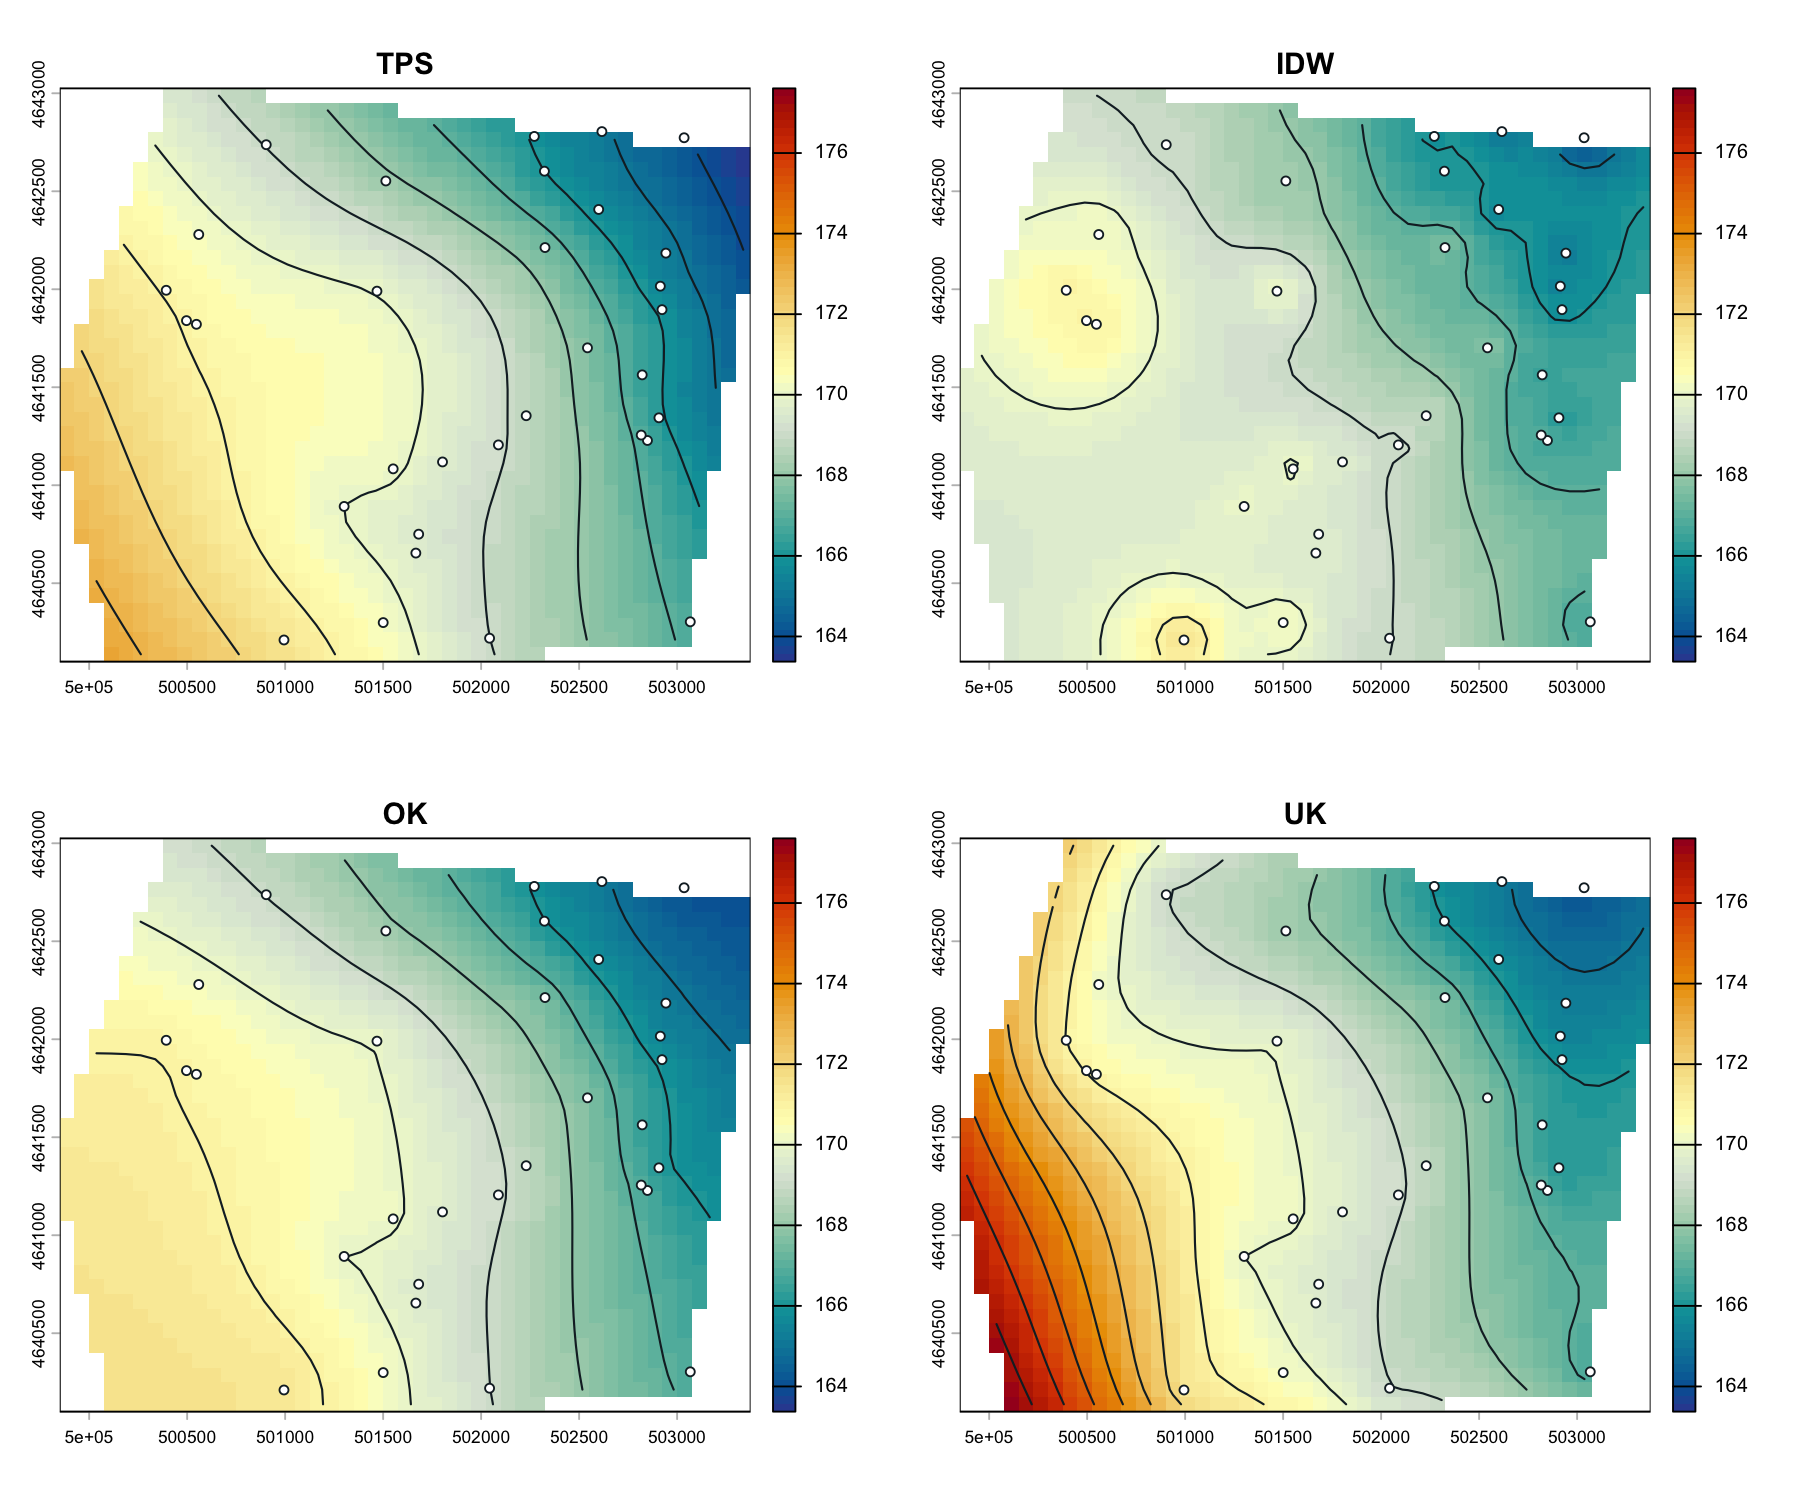
Four-method comparison
Methods: TPS, IDW, OK, UK. Units: synthetic head units; identical 75-metre cells. No method is universally preferred. Full comparison.
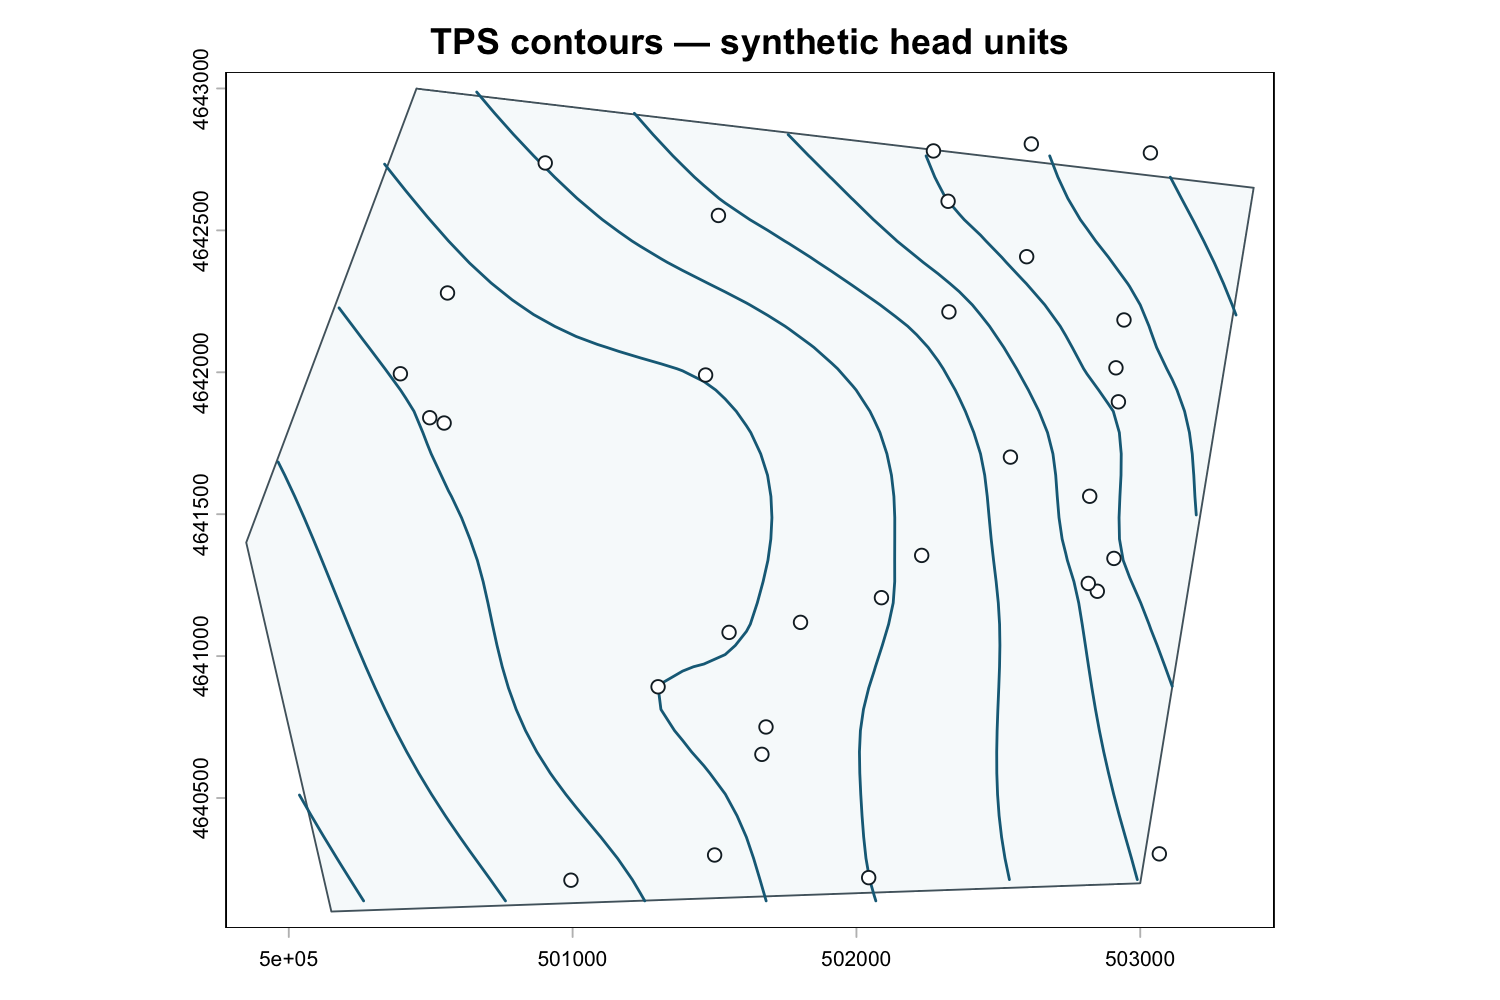
Contour-only product
Method: ps_contours() from TPS.
Units: one synthetic head unit.
Contour settings.
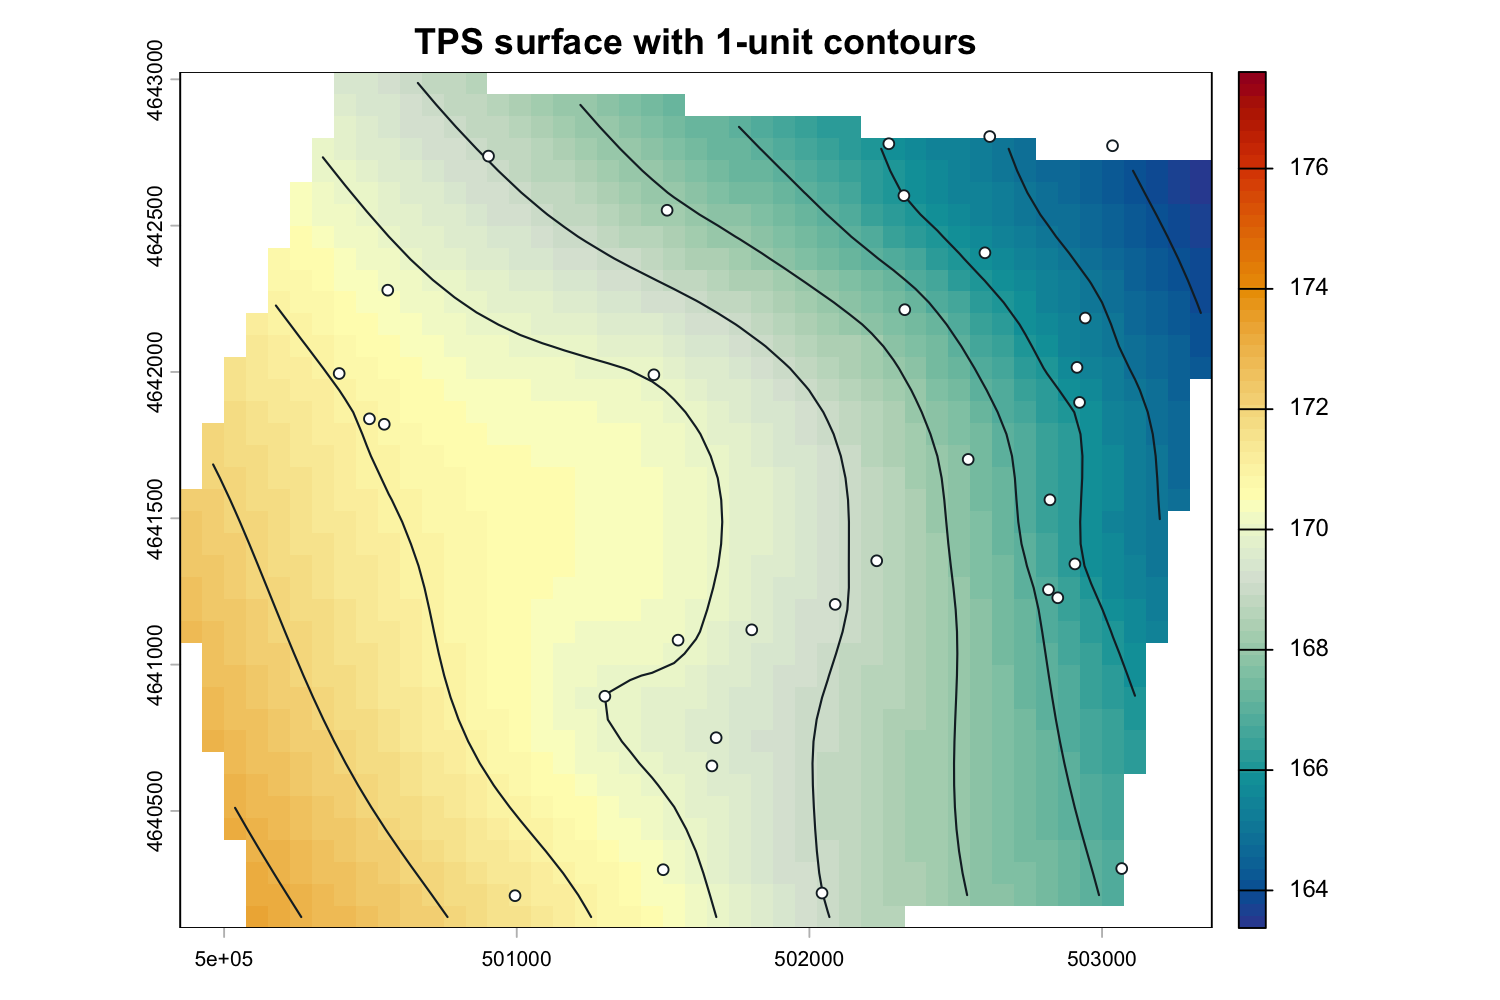
Surface plus contours
Method: TPS and regular contours. Units: synthetic head units. Quick start.
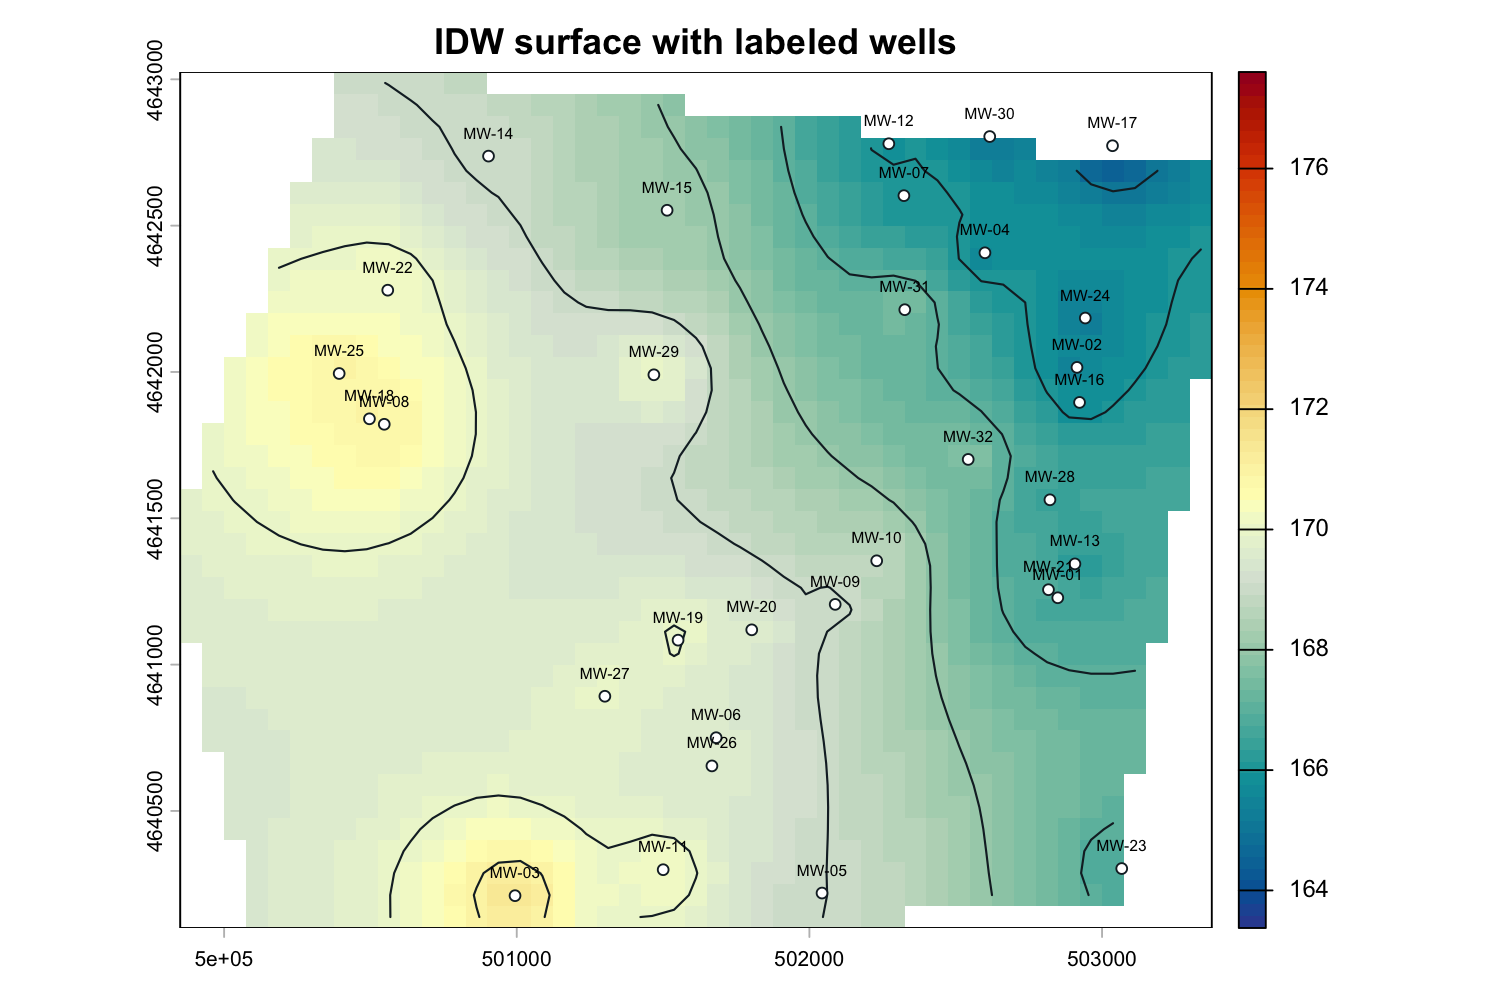
Surface plus labeled wells
Method: IDW with point labels. Units: synthetic head units. Labels connect the map to reviewable observations. Observation fields.
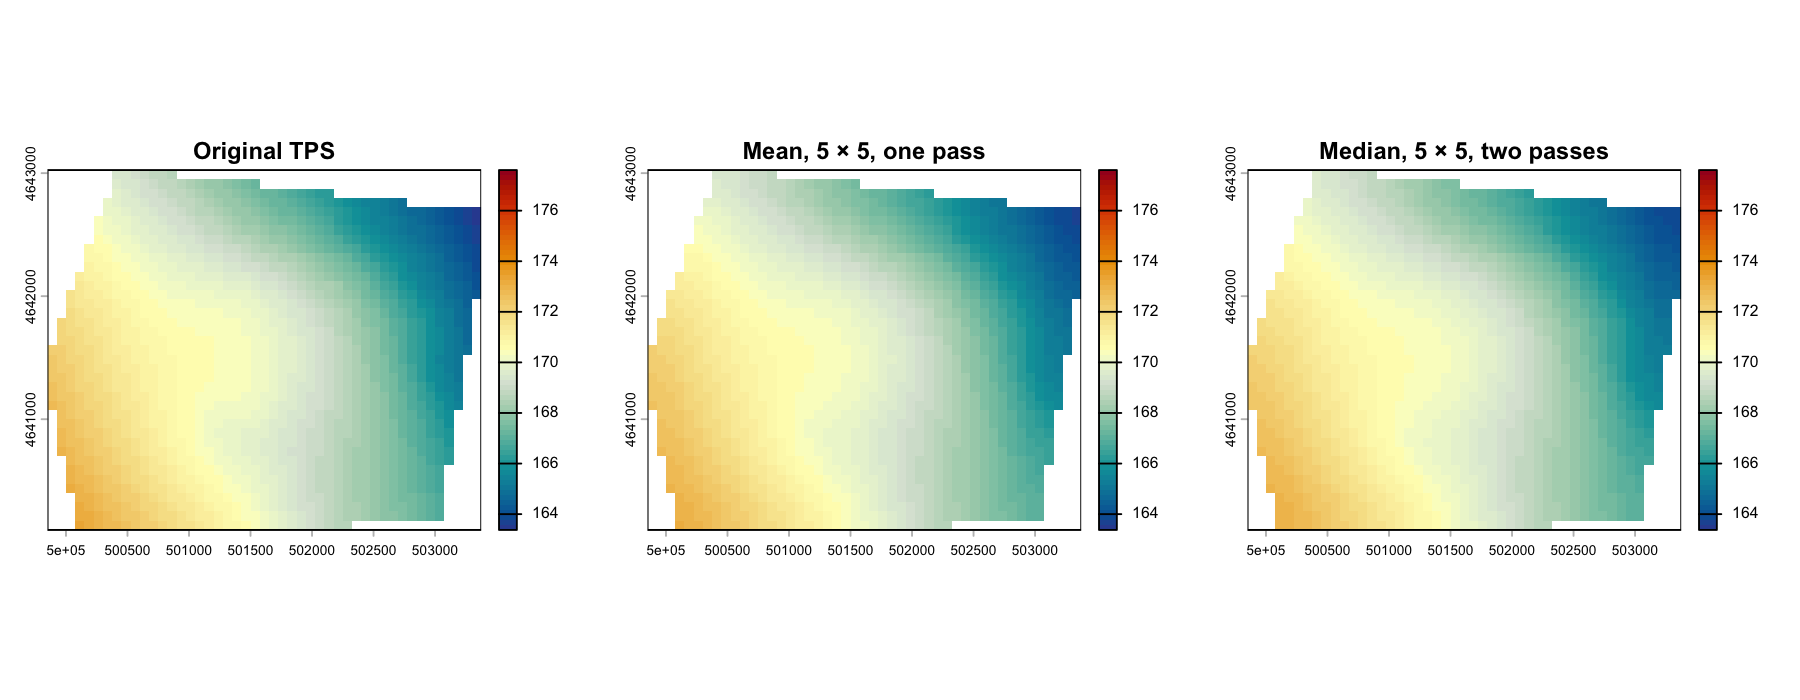
Unsmoothed and smoothed surfaces
Methods: original TPS, focal mean, focal median. Units: synthetic head units. Smoothing changes the model. Smoothing cautions.
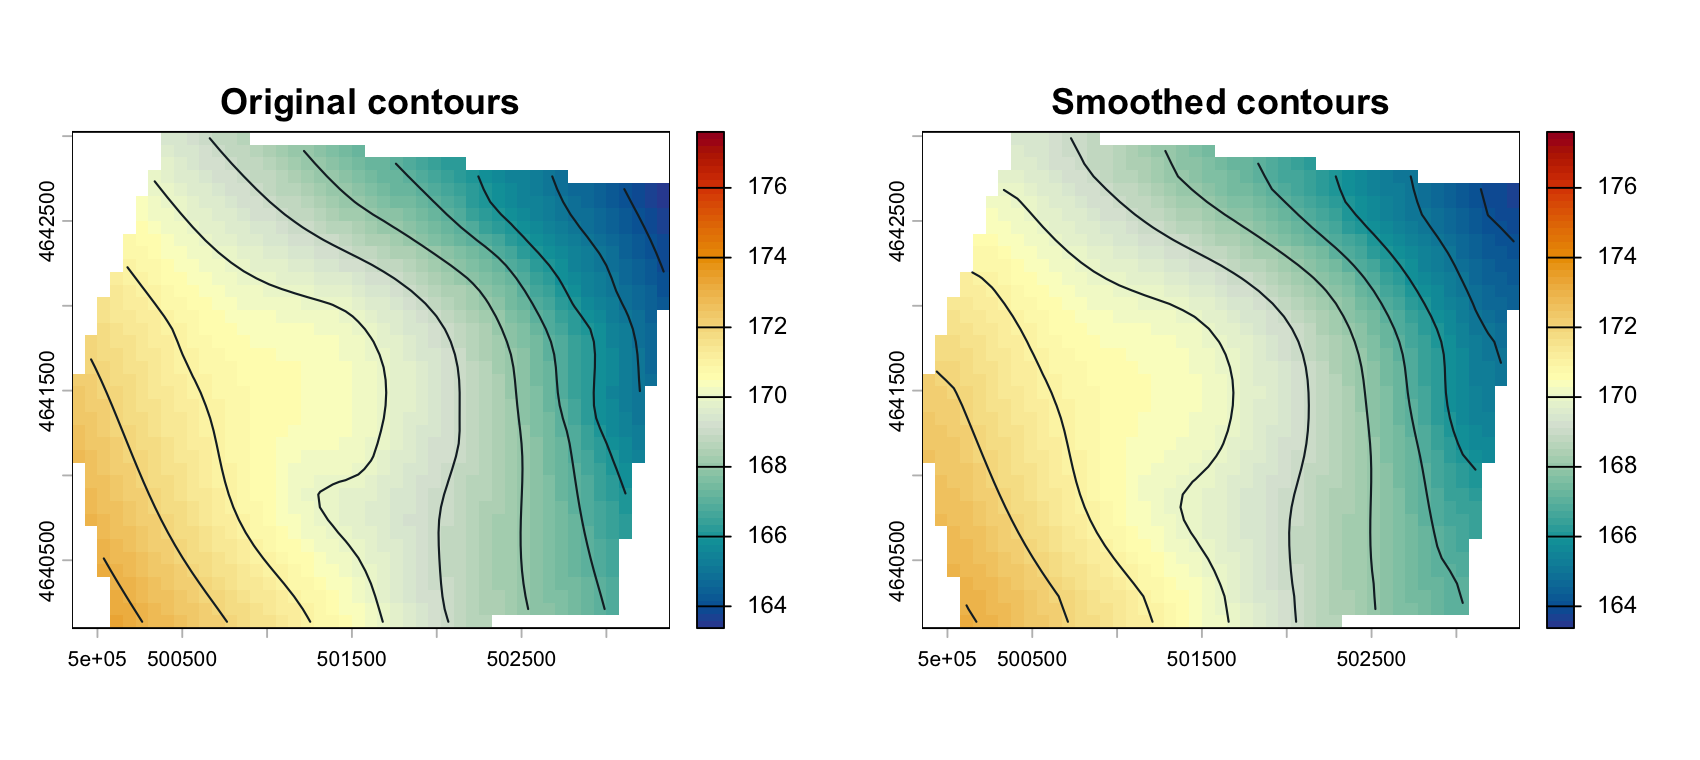
Unsmoothed and smoothed contours
Method: contours before and after focal mean smoothing. Units: synthetic head units. Retain the original.
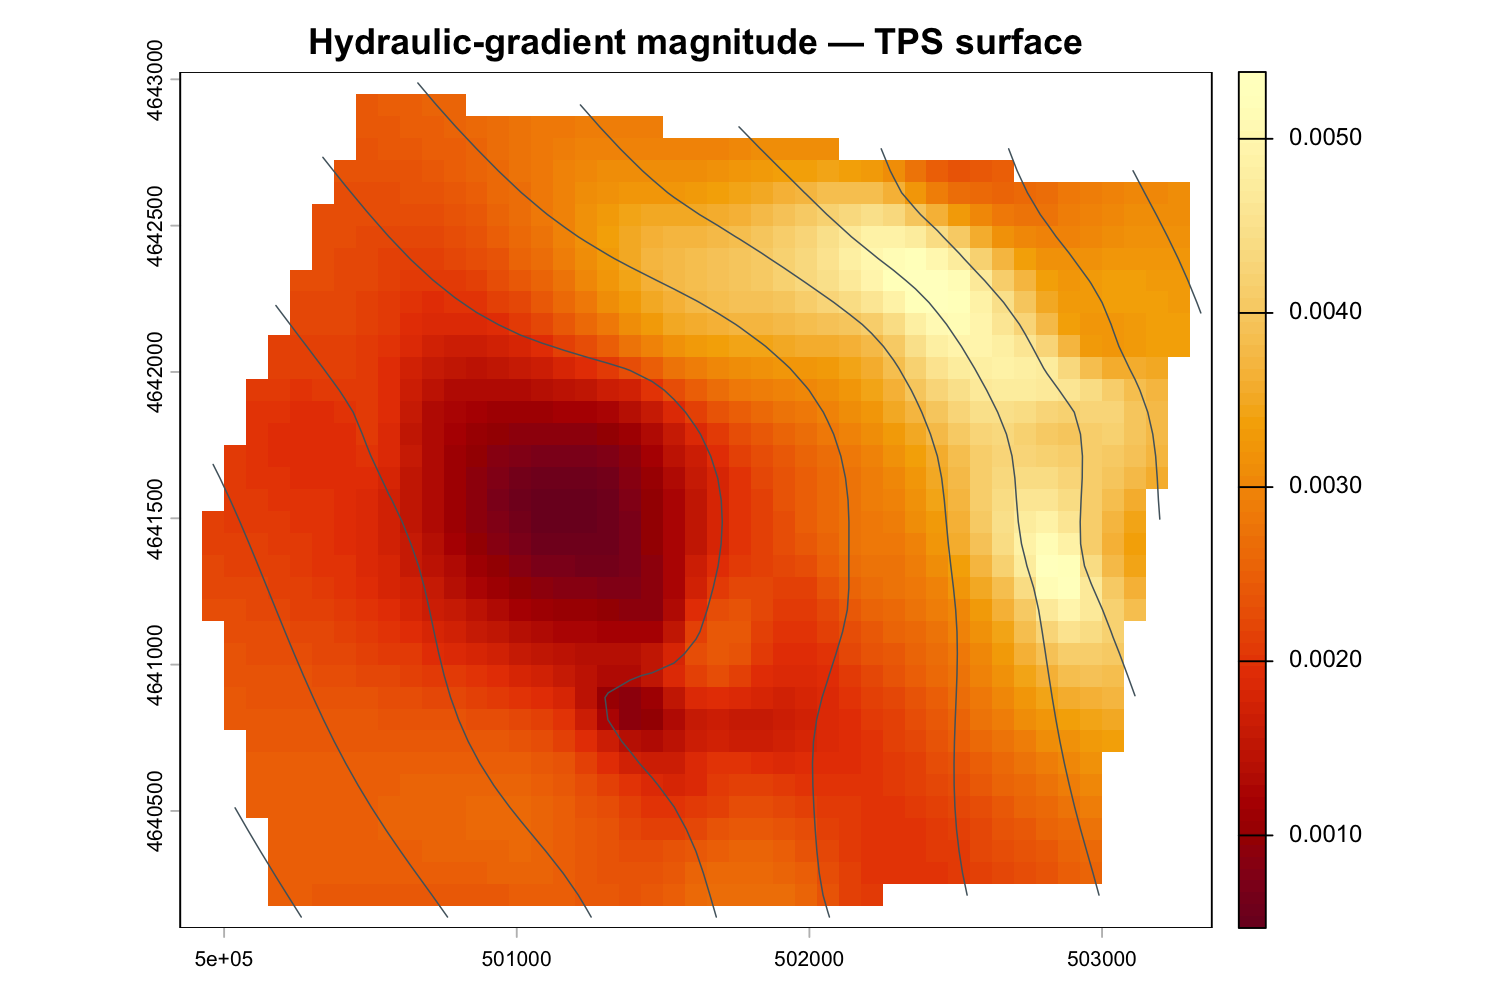
Hydraulic-gradient raster
Method: terrain derivative of the TPS surface. Units: head change per horizontal map unit. Gradient products.
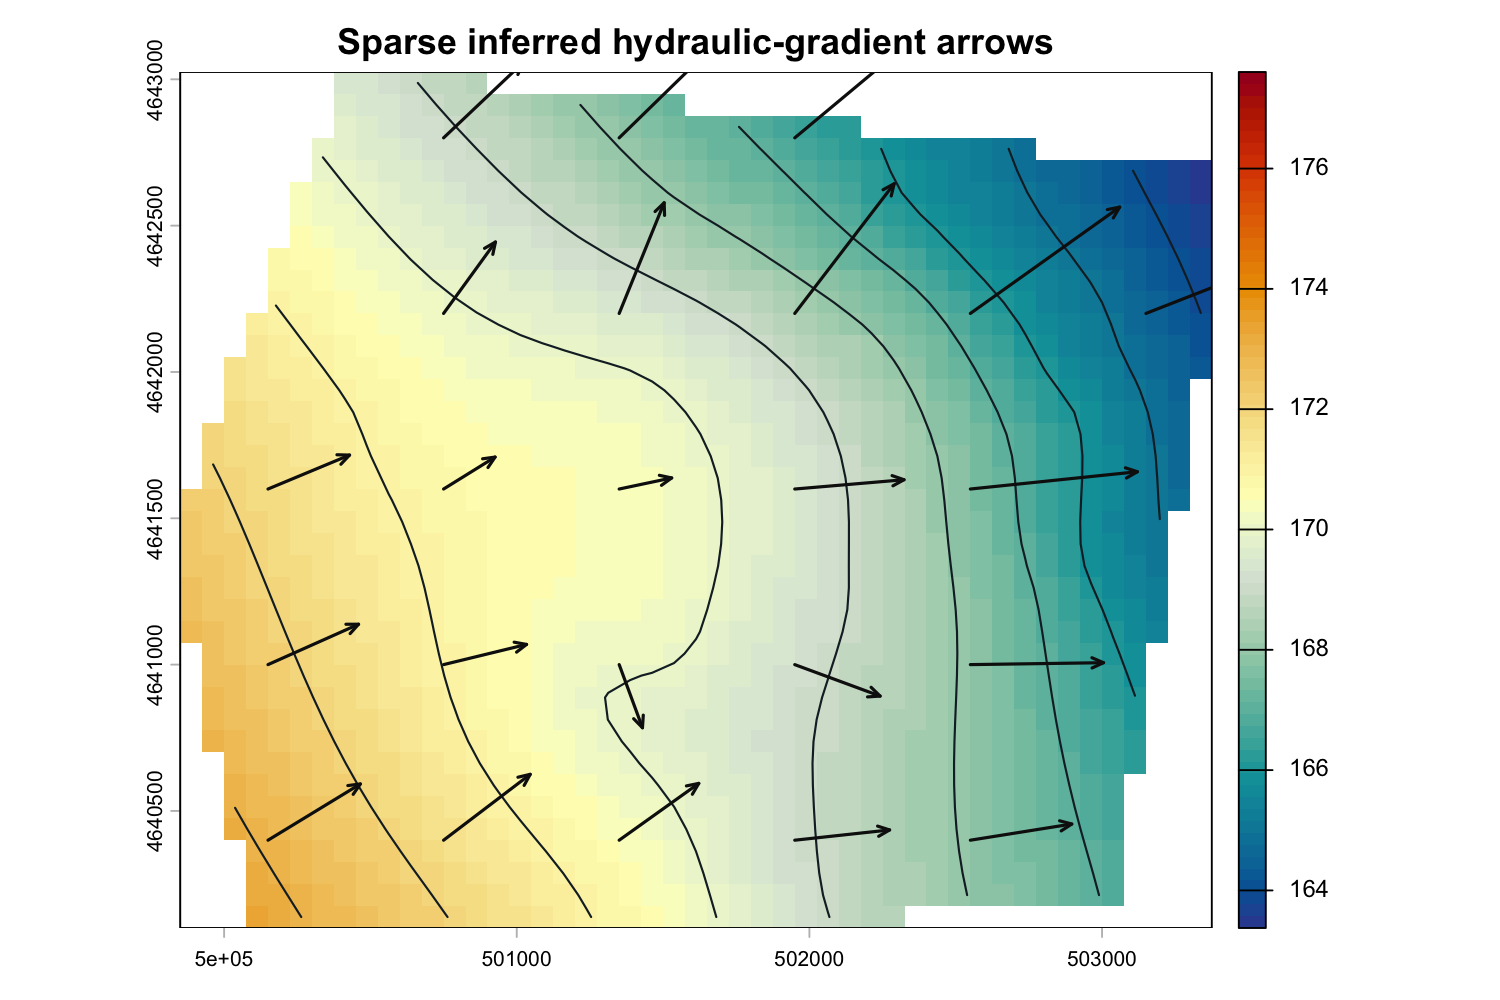
Sparse arrow layout
Method: ps_flow_arrows(), larger
res_factor. Units: direction from modeled
head; length is cartographic. Arrow
controls.
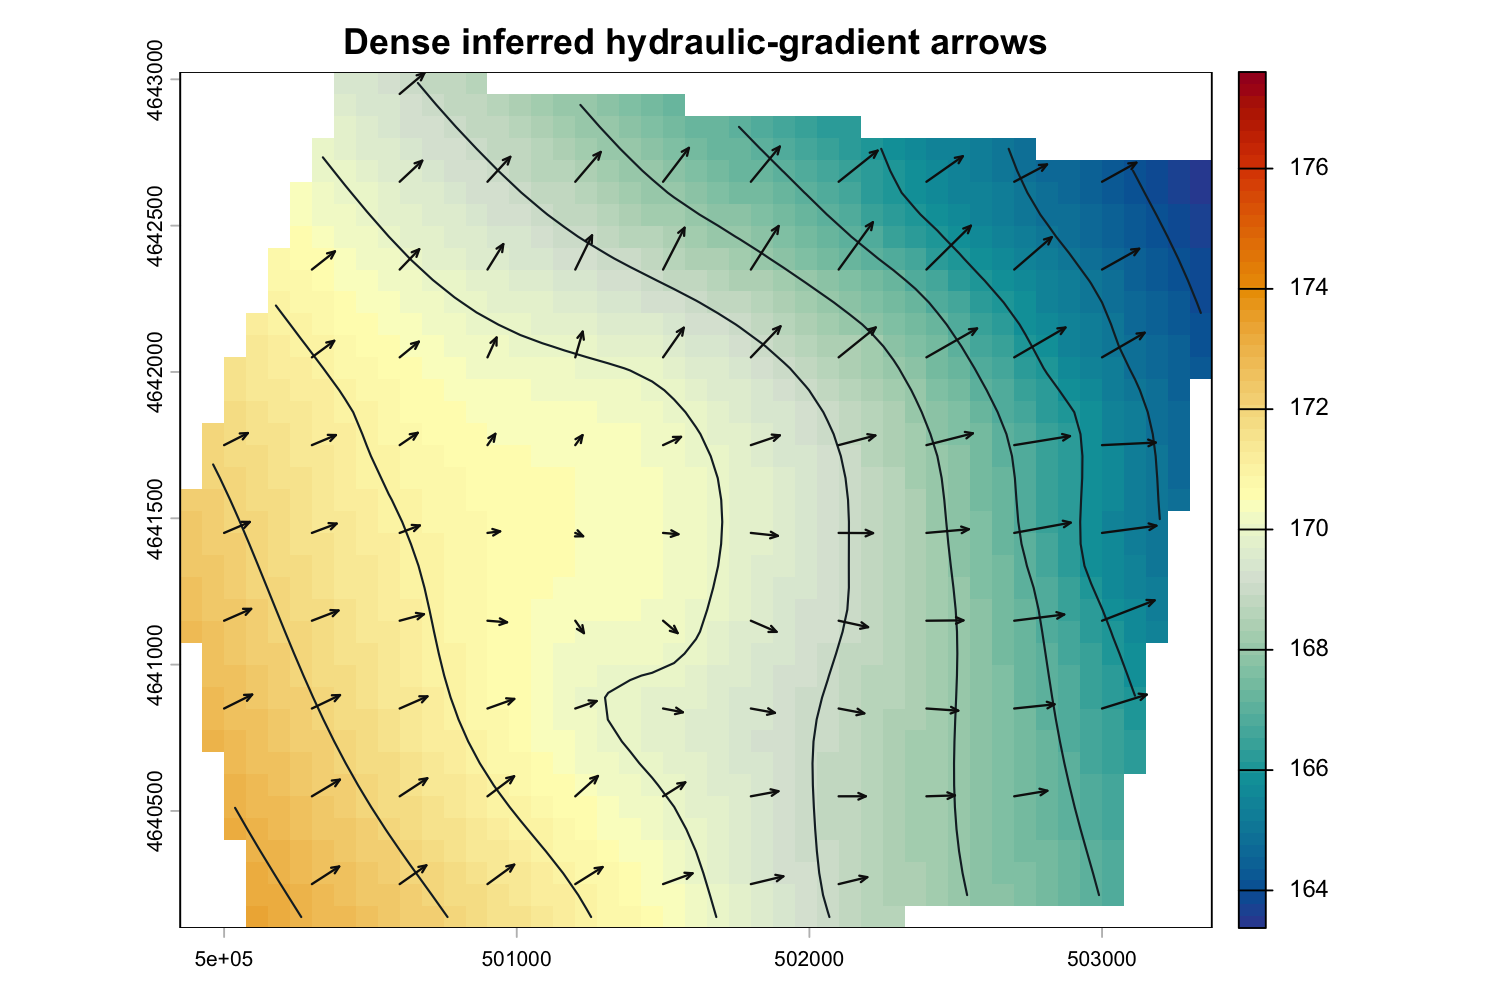
Dense arrow layout
Method: ps_flow_arrows(), smaller
res_factor. Units: direction from modeled
head; density is not monitoring density.
Arrow controls.
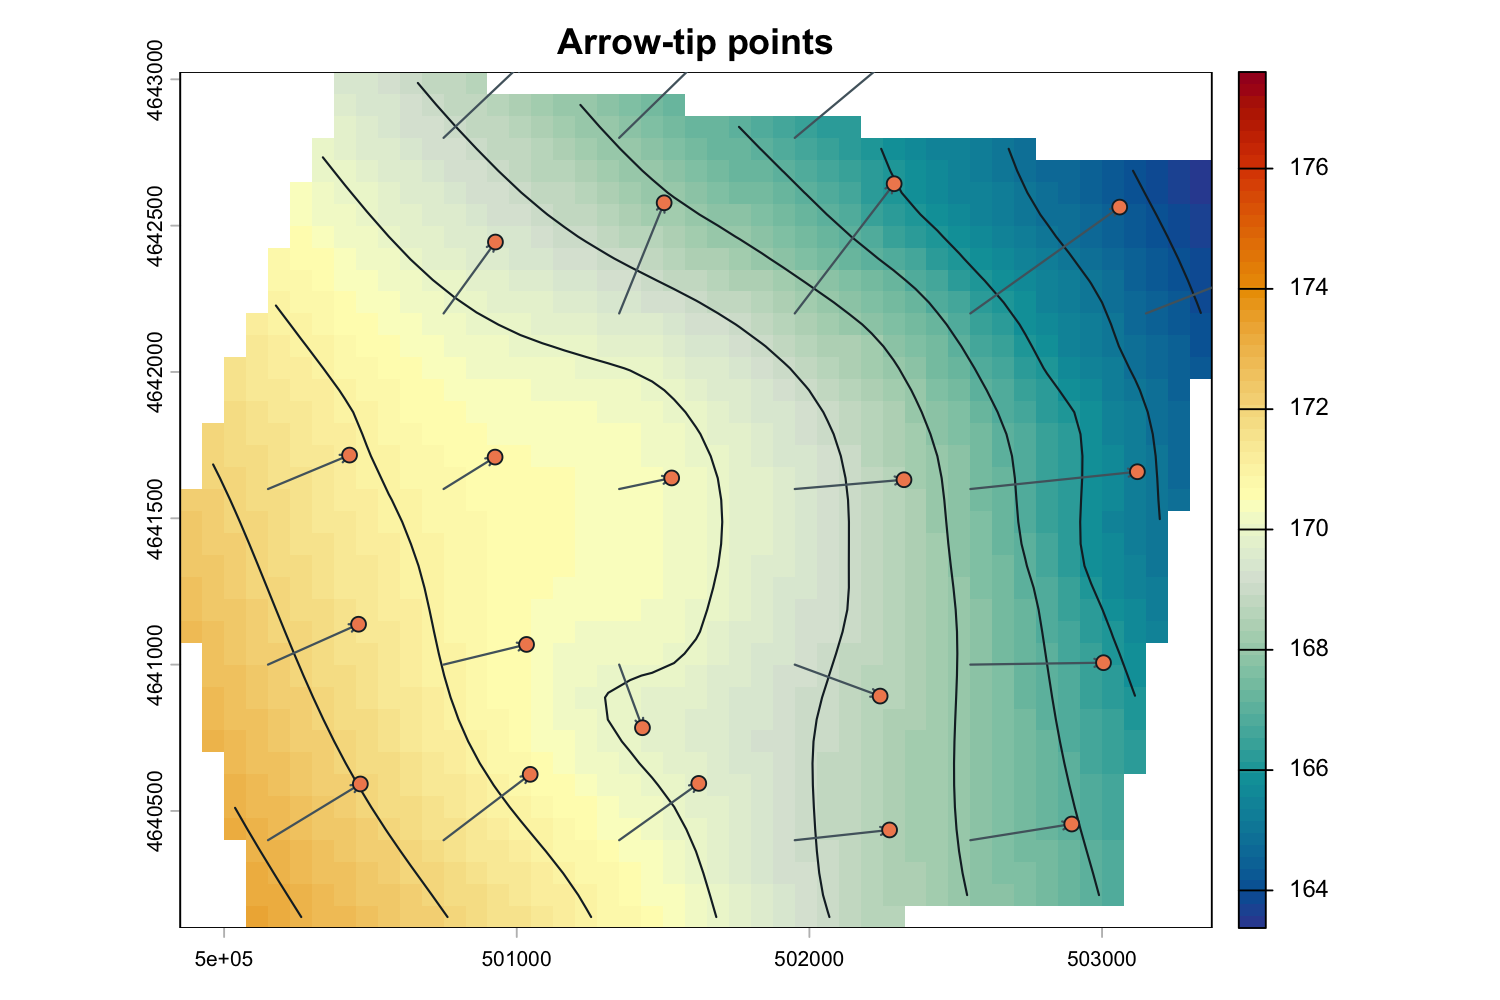
Arrow-tip points
Method: ps_arrow_vertices(which = “last”).
Units: UTM metres. Tips support the downgradient check.
Direction verification.
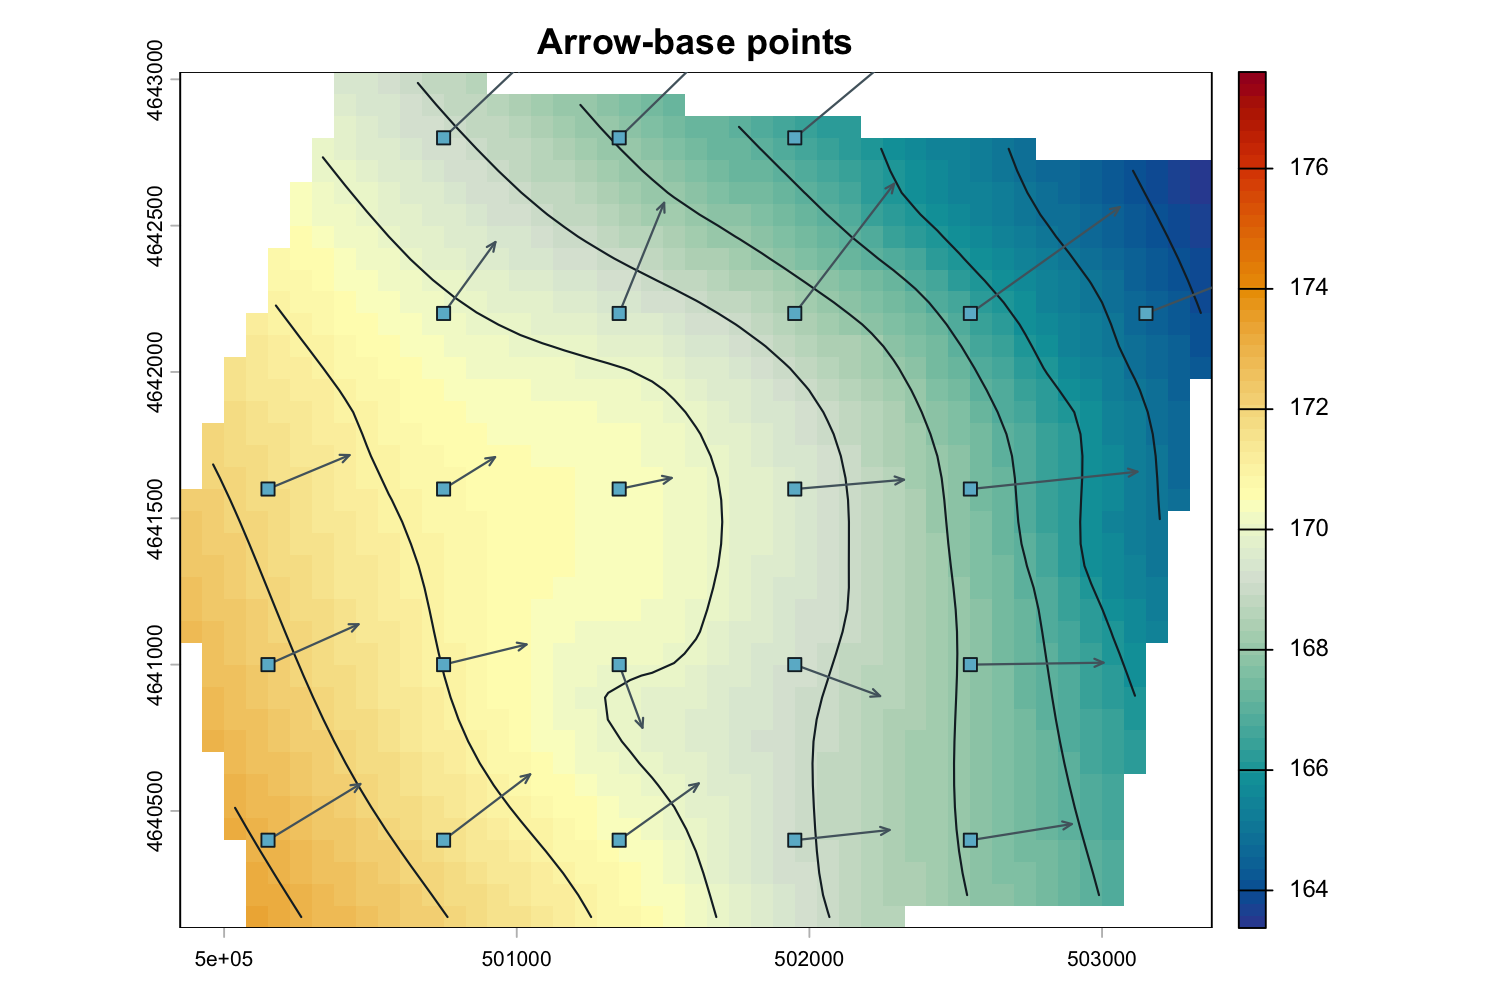
Arrow-base points
Method: ps_arrow_vertices(which =
“first”). Units: UTM metres.
Direction verification.
Exported native quicklook
Method: ps_export_surfaces() and
ps_quicklook(). Units: synthetic head
units. Export and read back.
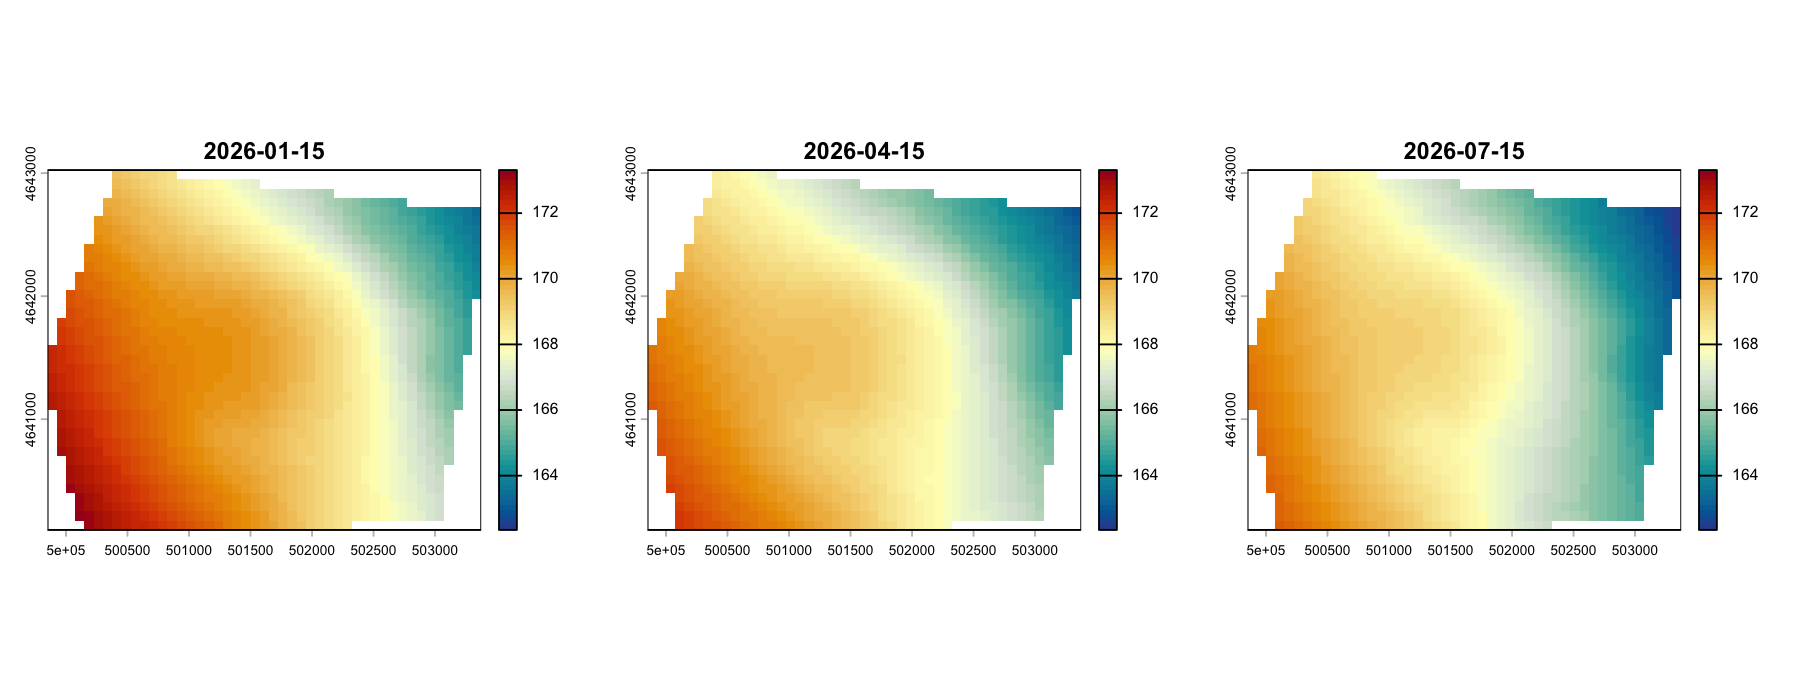
Repeated monitoring events
Method: external R iteration around TPS on a common template. Units: synthetic head units. Event workflow.
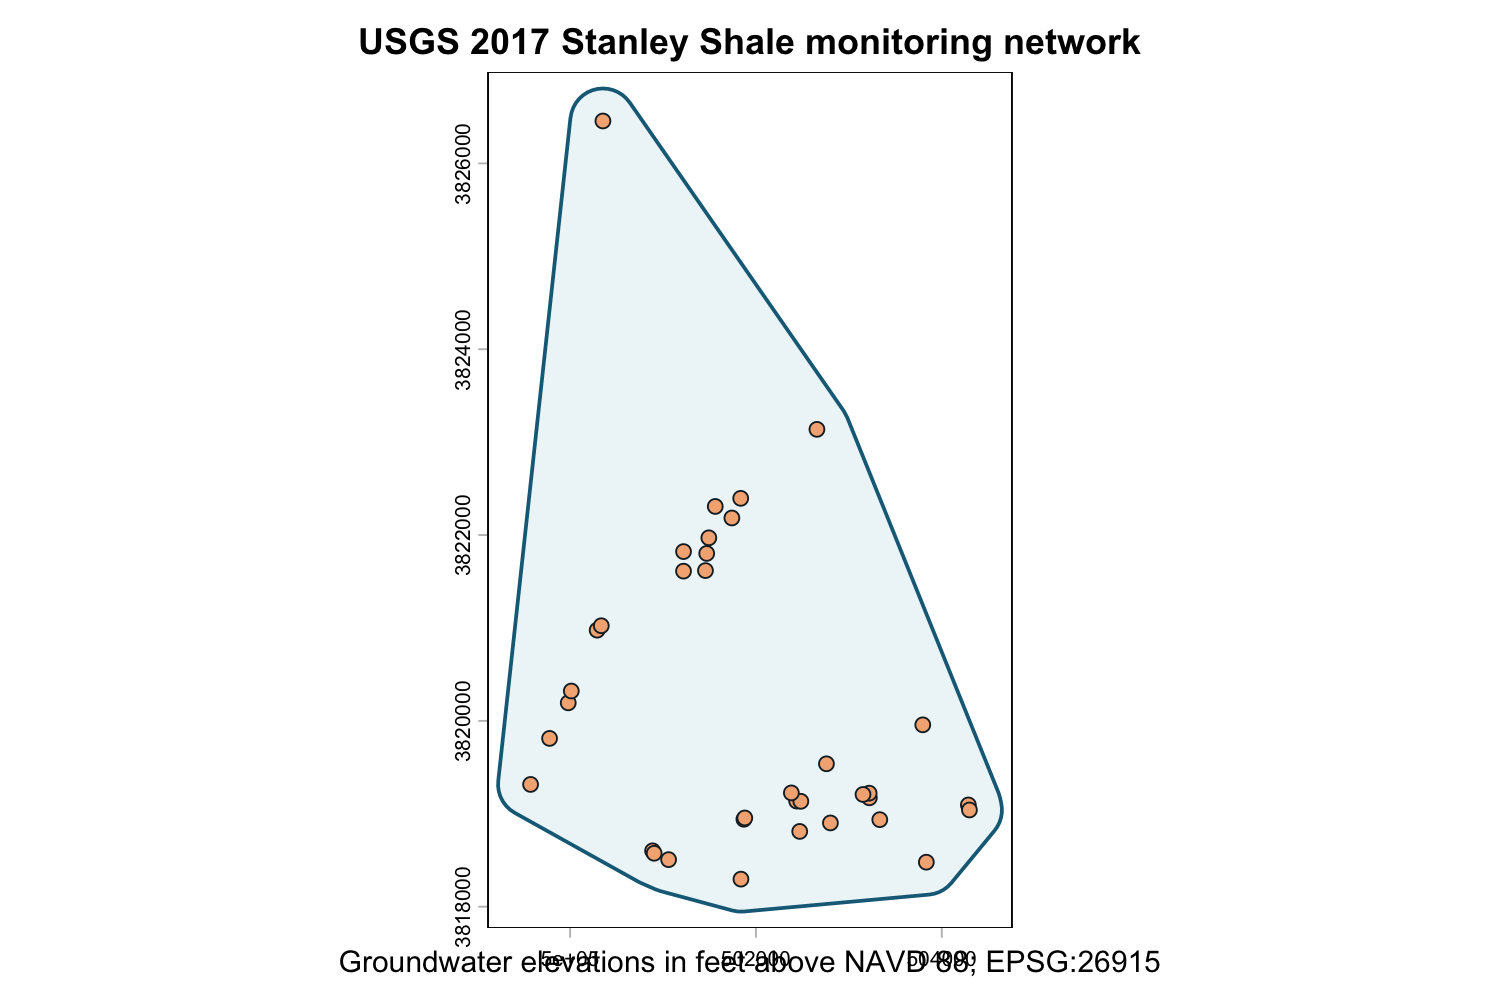
Public monitoring network
Source: USGS 2017 Stanley Shale subset. Units: NAD83 UTM zone 15N metres. Source and filtering.
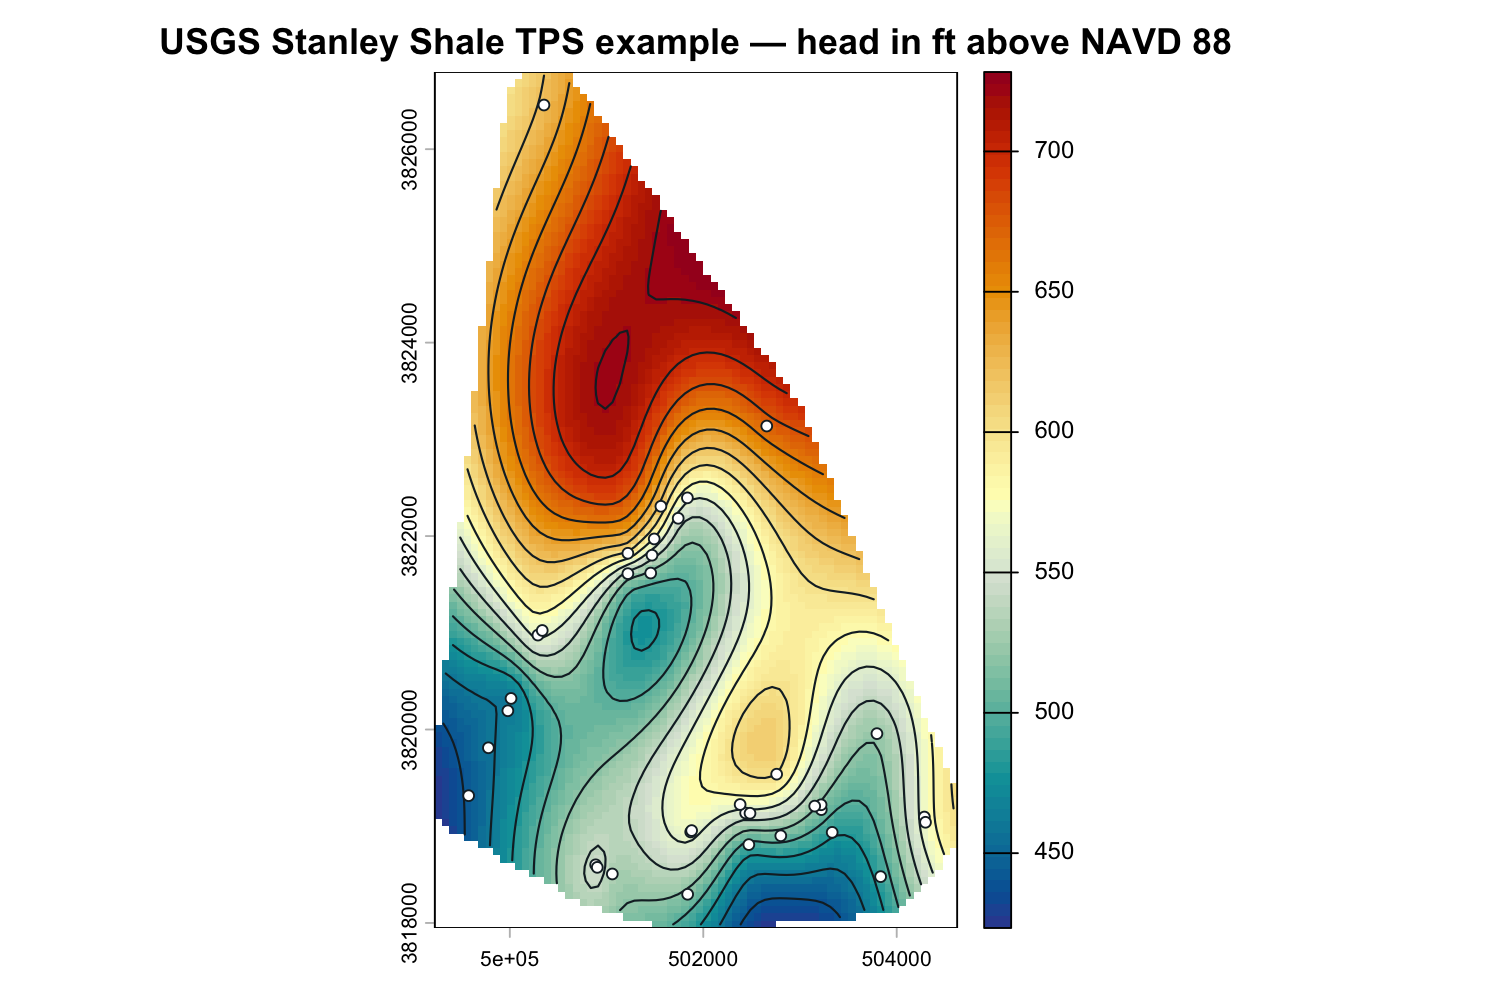
Public-data software example
Method: TPS with 20-foot contours. Units: feet above NAVD 88; 75-metre cells. This is not the official interpreted surface. Complete example.
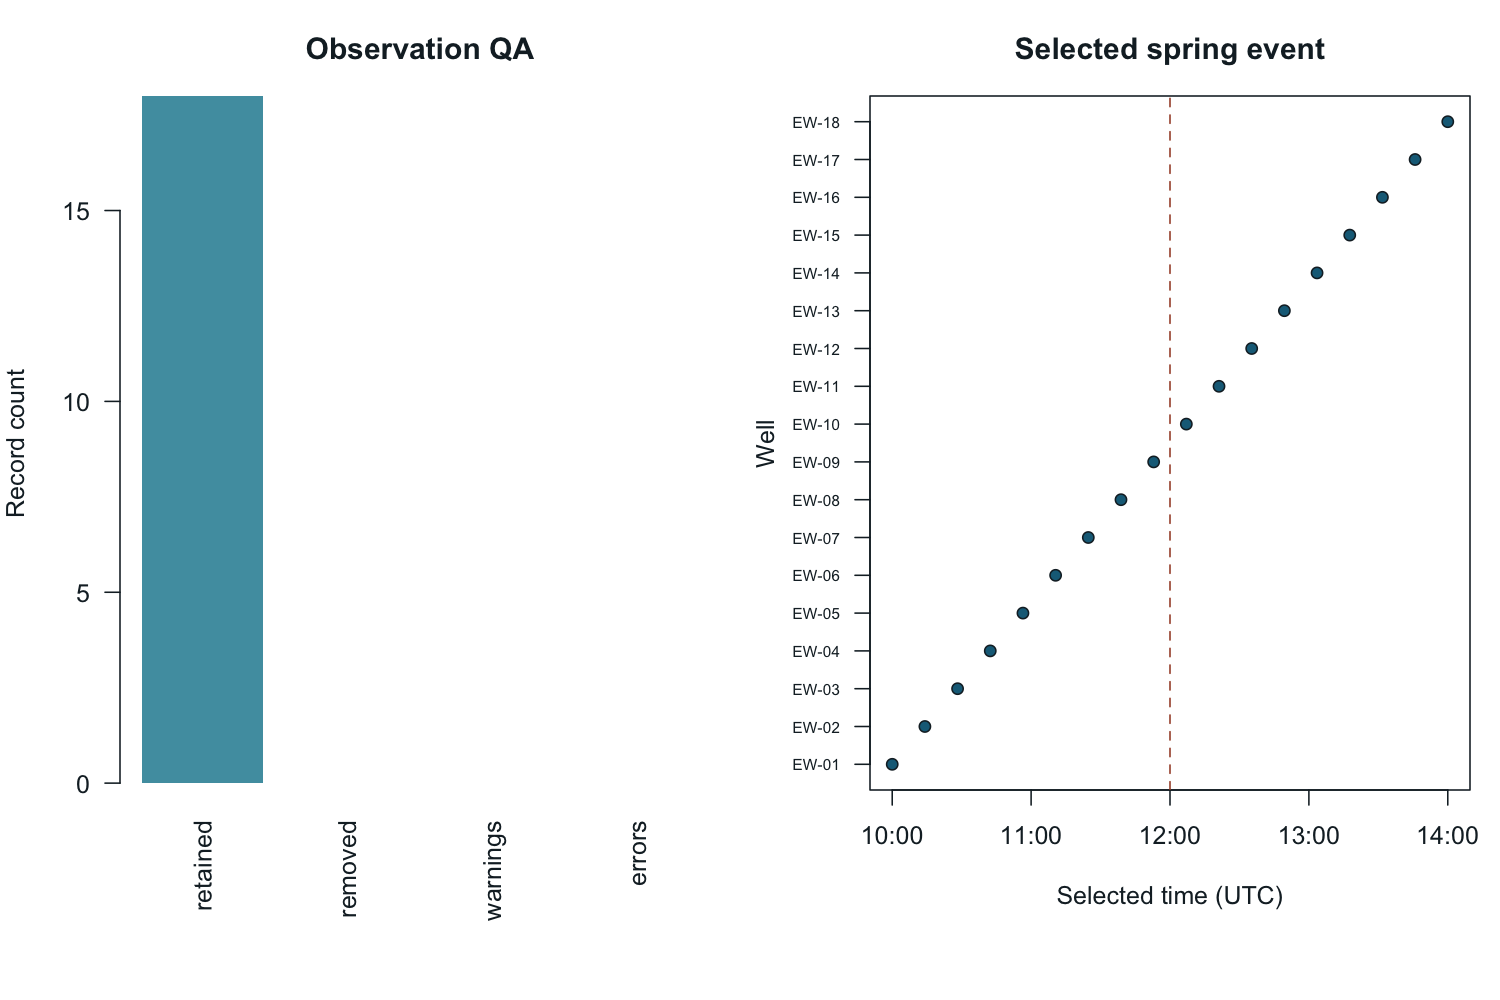
Observation QA and event selection
Methods: ps_check_observations() and
ps_select_event(). Settings: nearest
reading in a three-hour window around noon UTC. A time window does not
guarantee hydraulic synchroneity.
QA and event workflow.
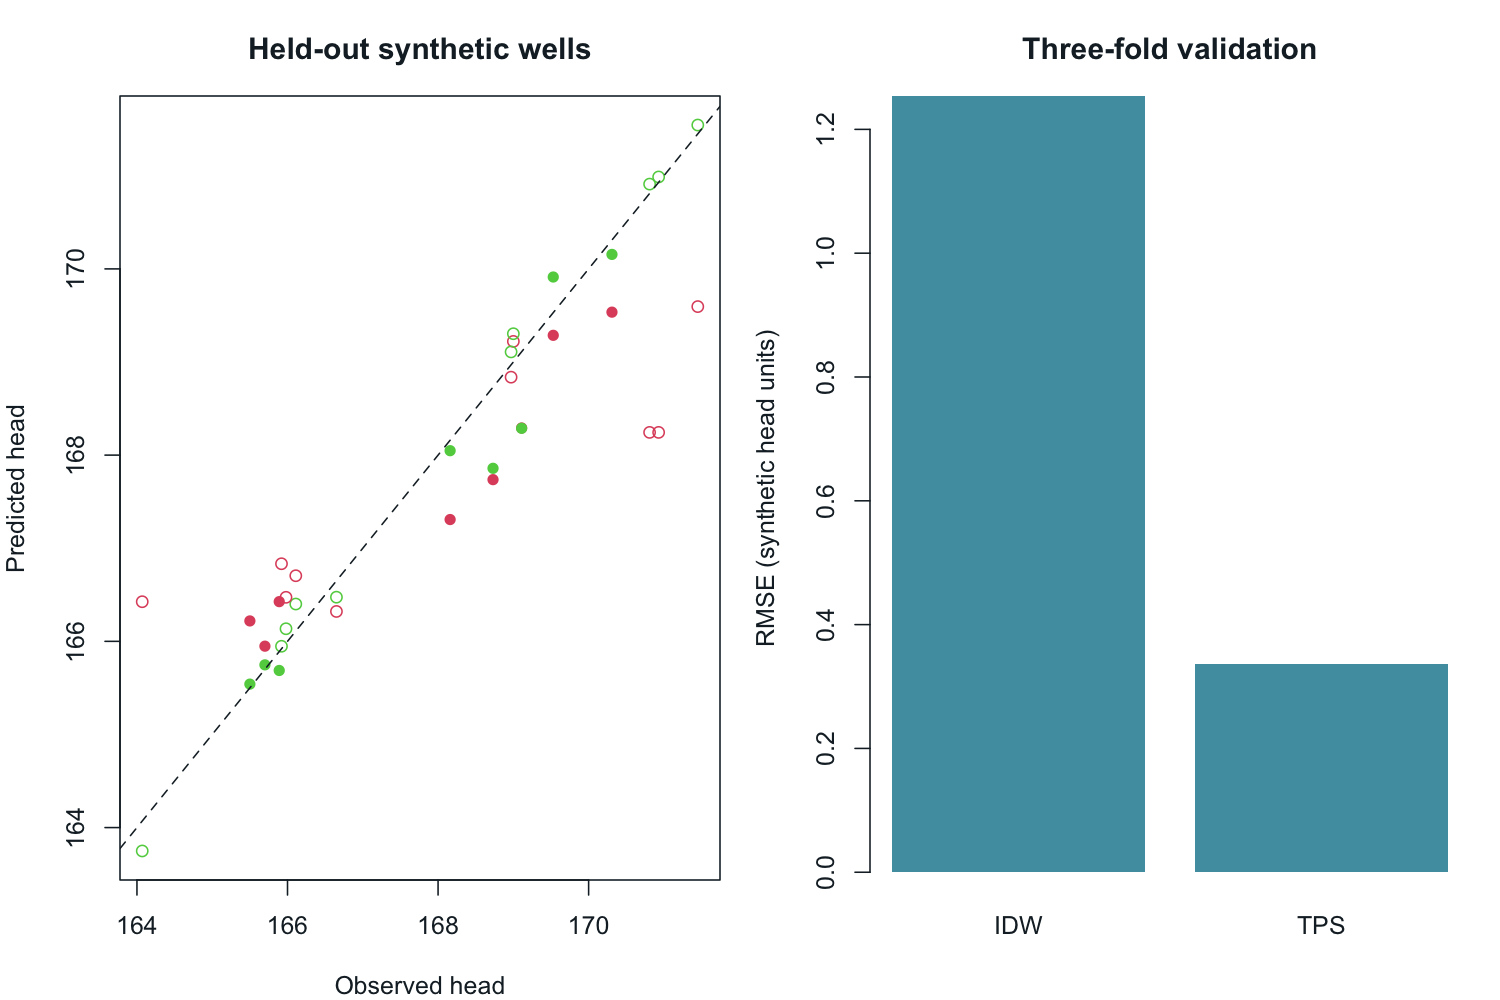
Held-out-well validation
Methods: IDW and TPS; three-fold direct prediction with seed 21. Units: synthetic head units. The errors describe this held-out-well task, not continuous area-wide accuracy. Validation designs.
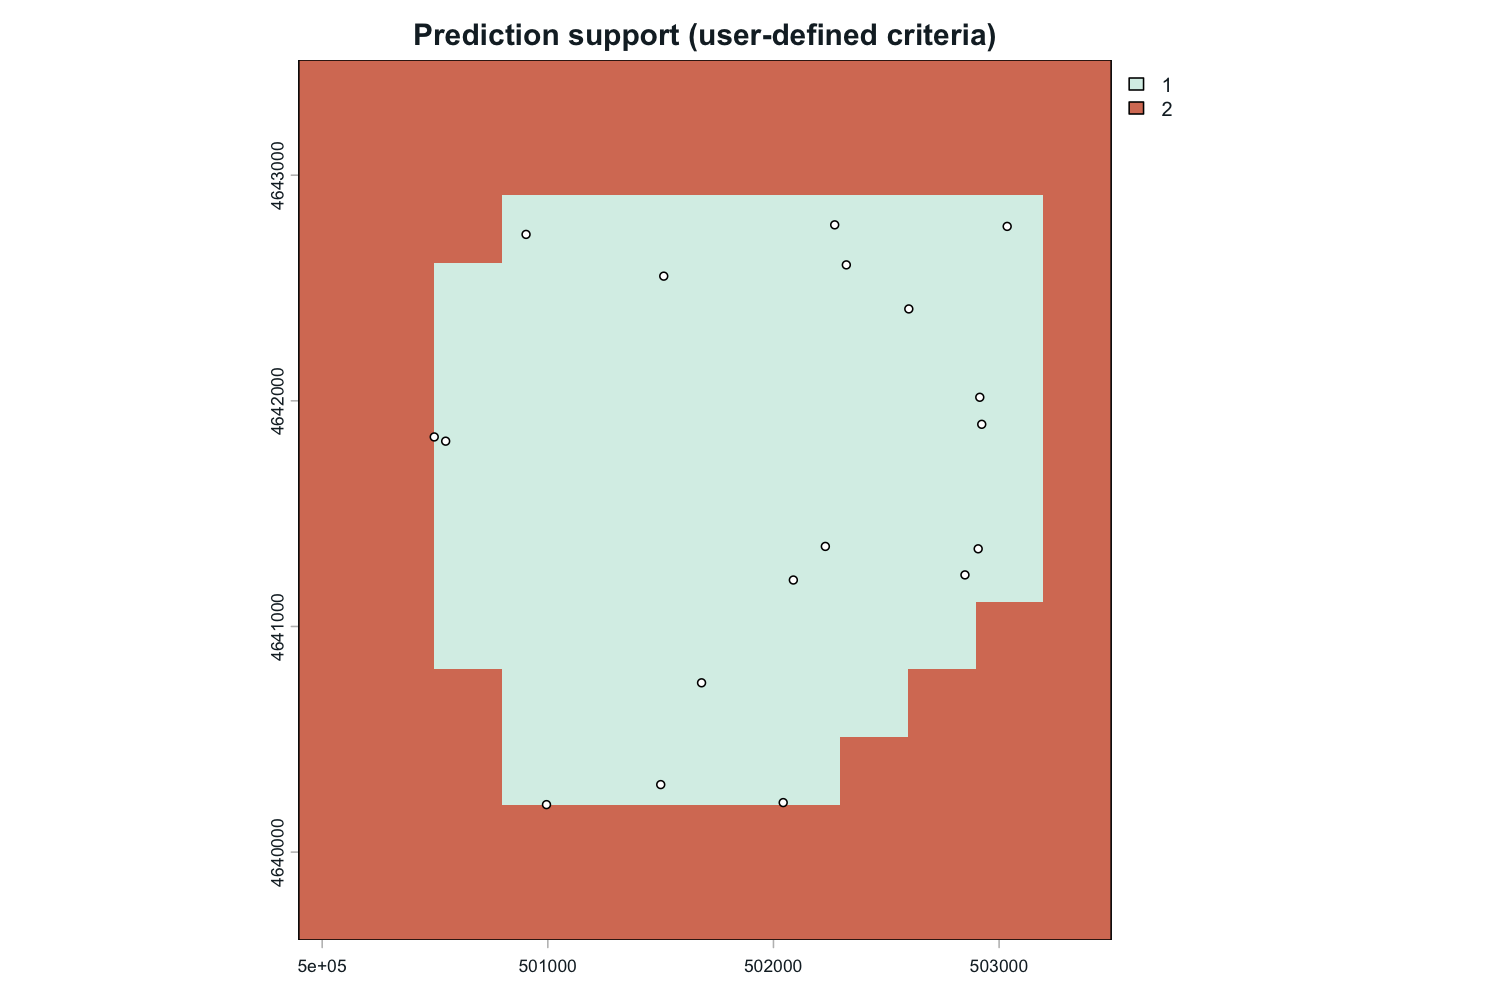
Prediction support
Method: support retained by
ps_interpolate(). Settings: 300-metre grid
and declared geometric criteria. Classes describe support, not
confidence or correctness.
Support guidance.
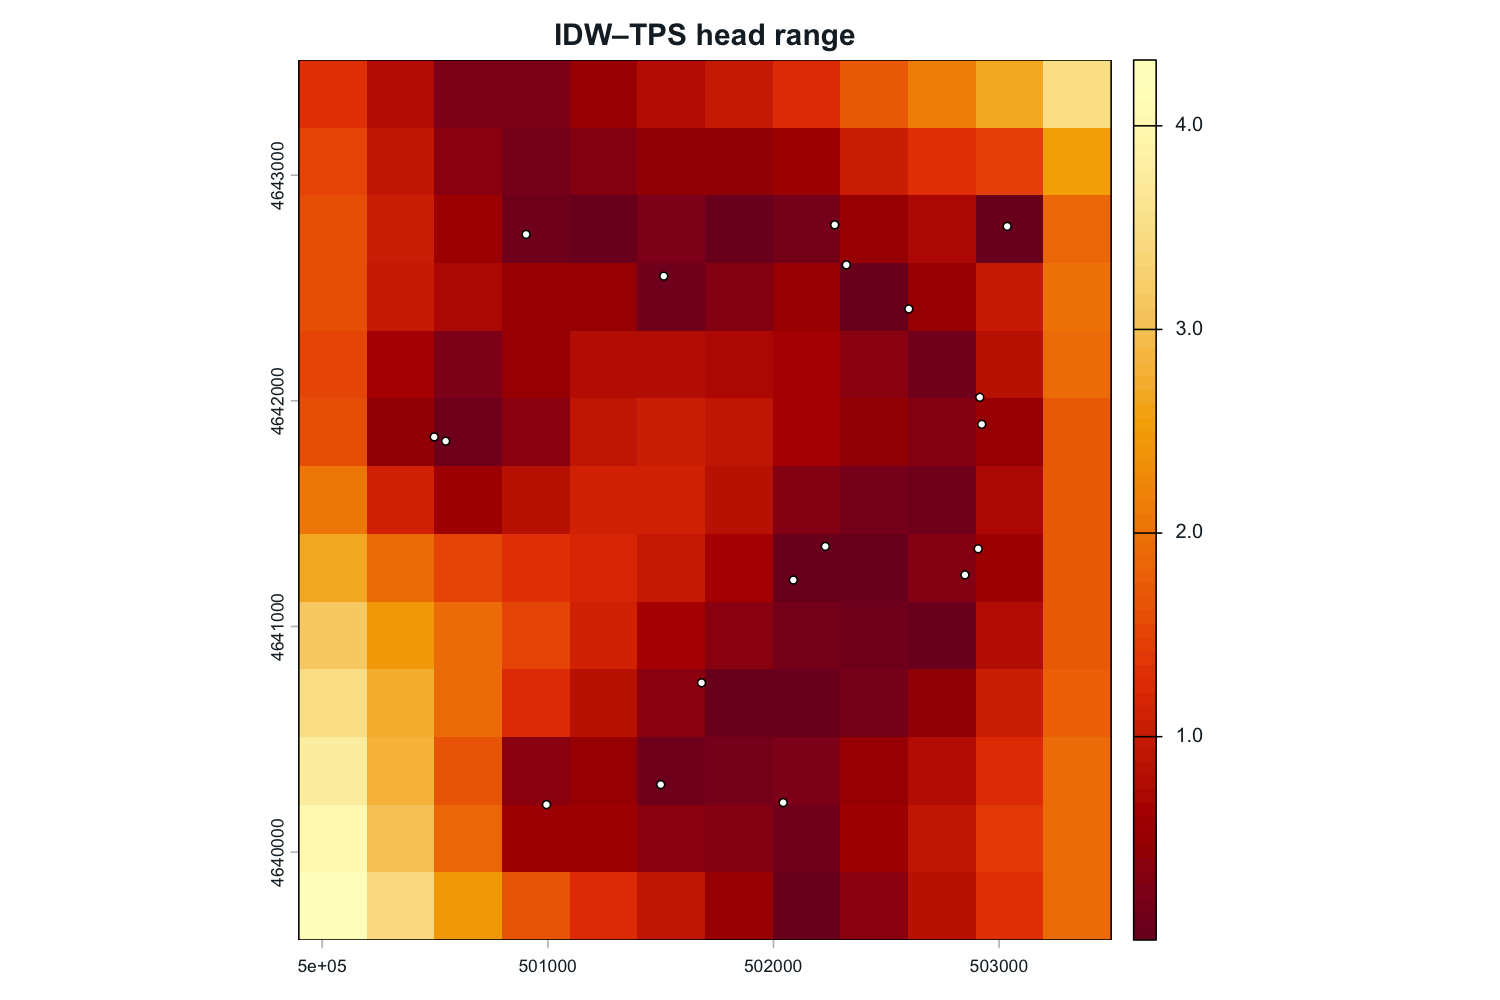
Method disagreement
Method: cellwise IDW–TPS range from
ps_method_disagreement(). Units: synthetic
head units. Method spread is descriptive and is not statistical
uncertainty. Ensembles and
disagreement.
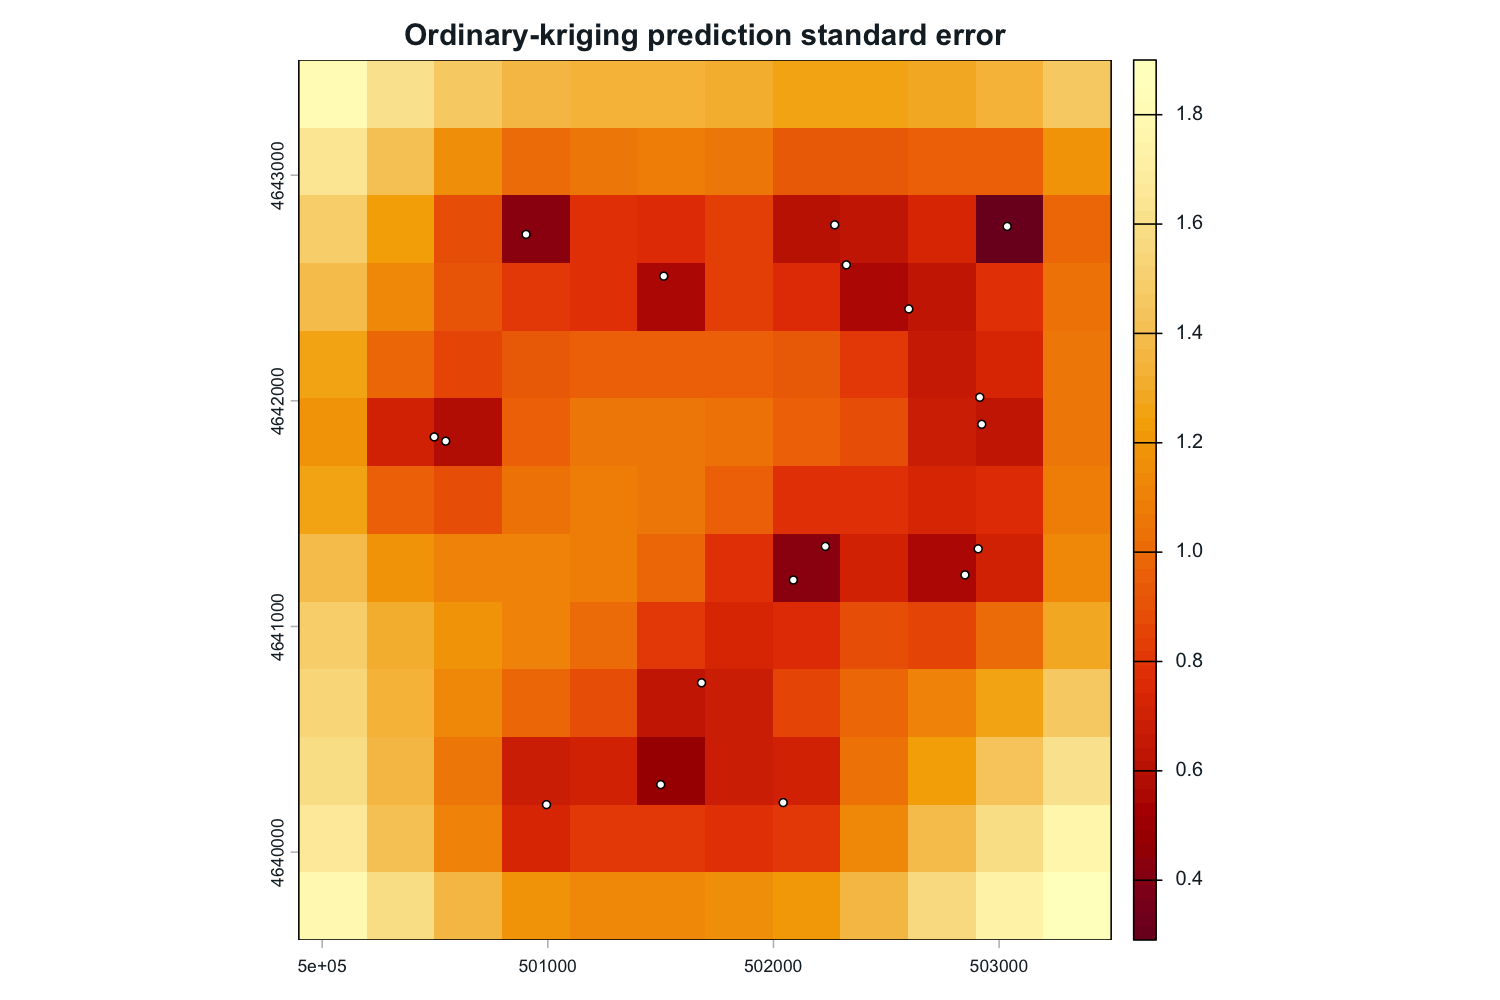
Model-conditional kriging uncertainty
Method: ordinary-kriging prediction standard error. Units: synthetic head units. It is conditional on the fitted covariance model and is not a universal error bound. Uncertainty scope.
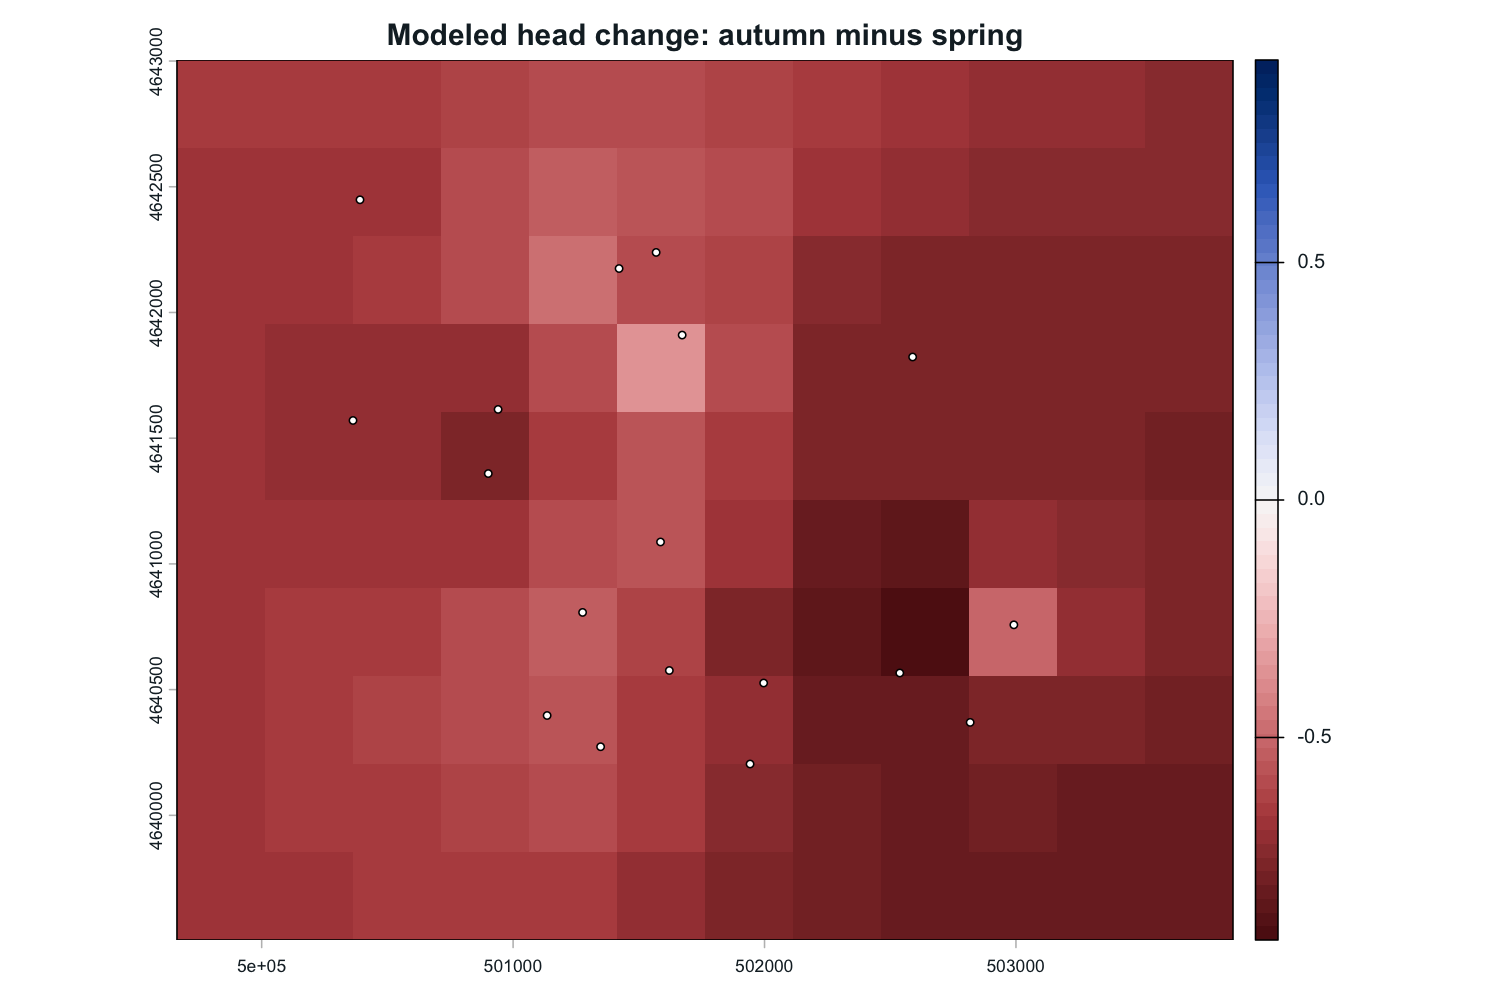
Monitoring-event head change
Method: paired wells and common-grid IDW surfaces. Units: synthetic head units; autumn minus spring. Modeled head change is not storage change. Event comparison.
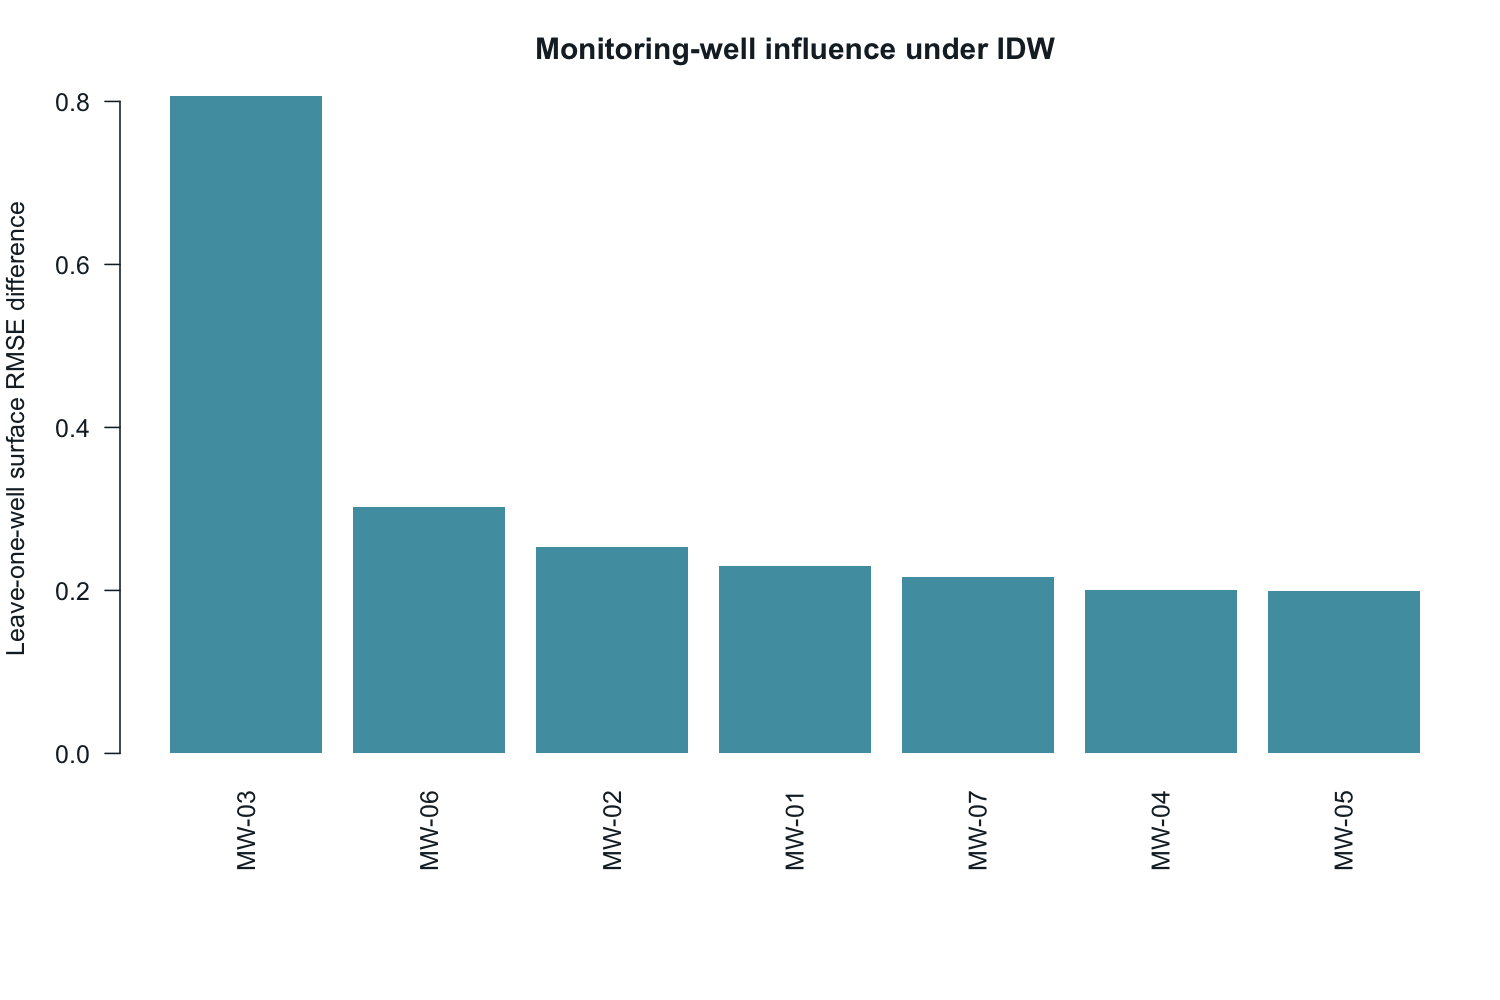
Leave-one-well influence
Method: ps_well_influence() with IDW and
400-metre cells. Units: synthetic head units. Ranking
depends on the method, grid, network, and comparison metric.
Network sensitivity.
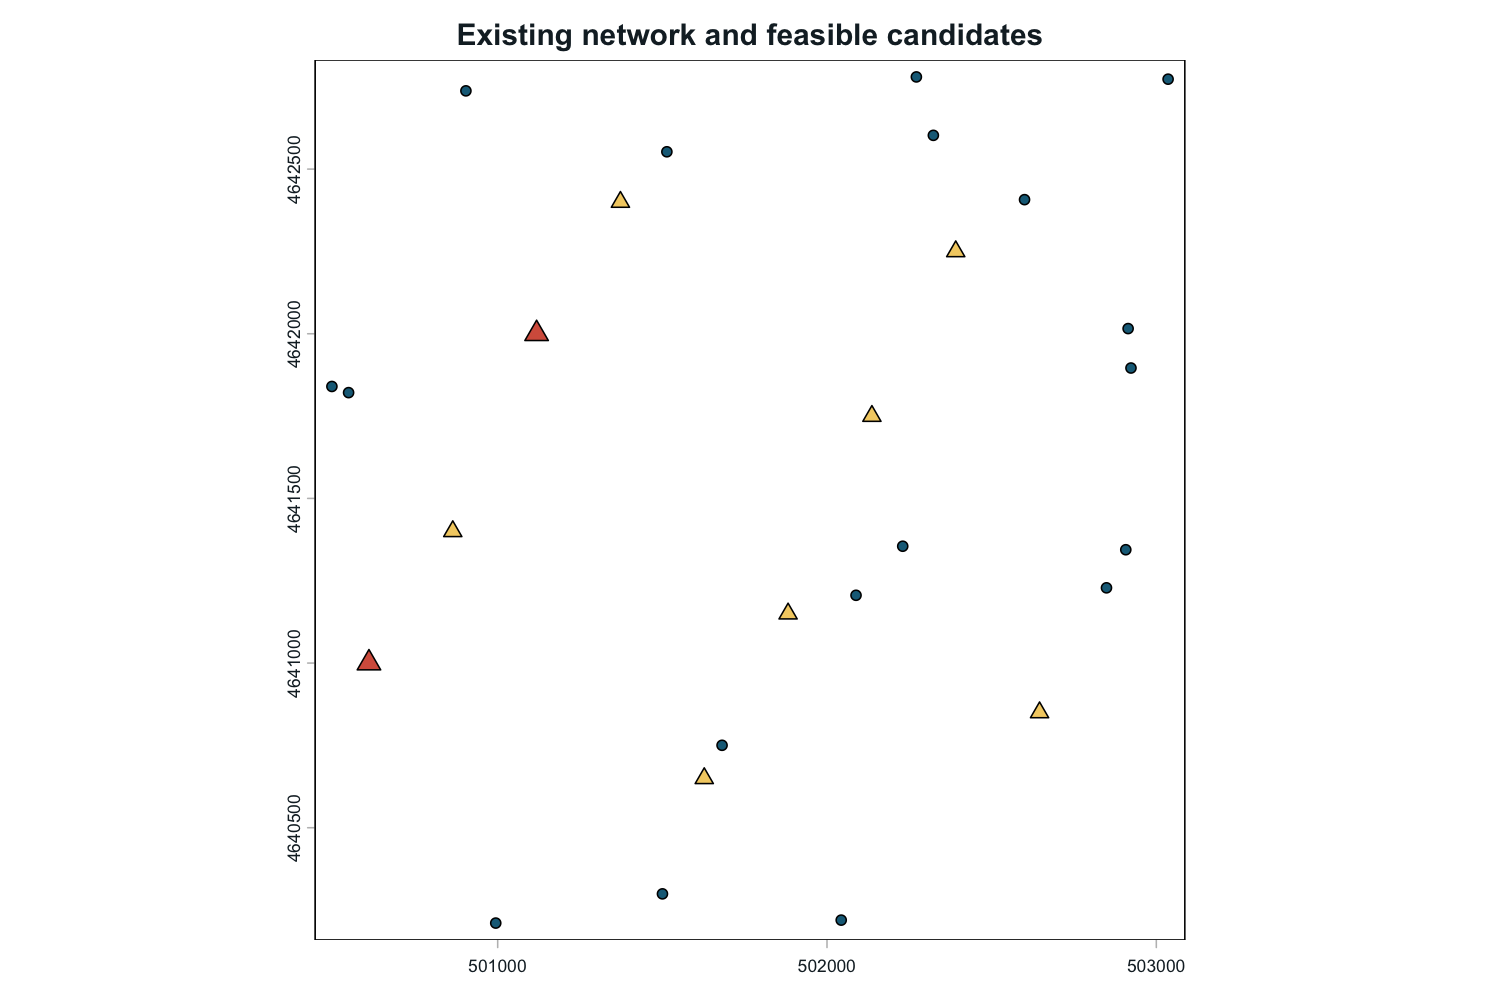
Candidate monitoring locations
Method: sequential spatial-coverage scoring with two selections. Units: projected metres. Scores do not replace access, screen design, feasibility, budget, or permitting review. Candidate constraints.
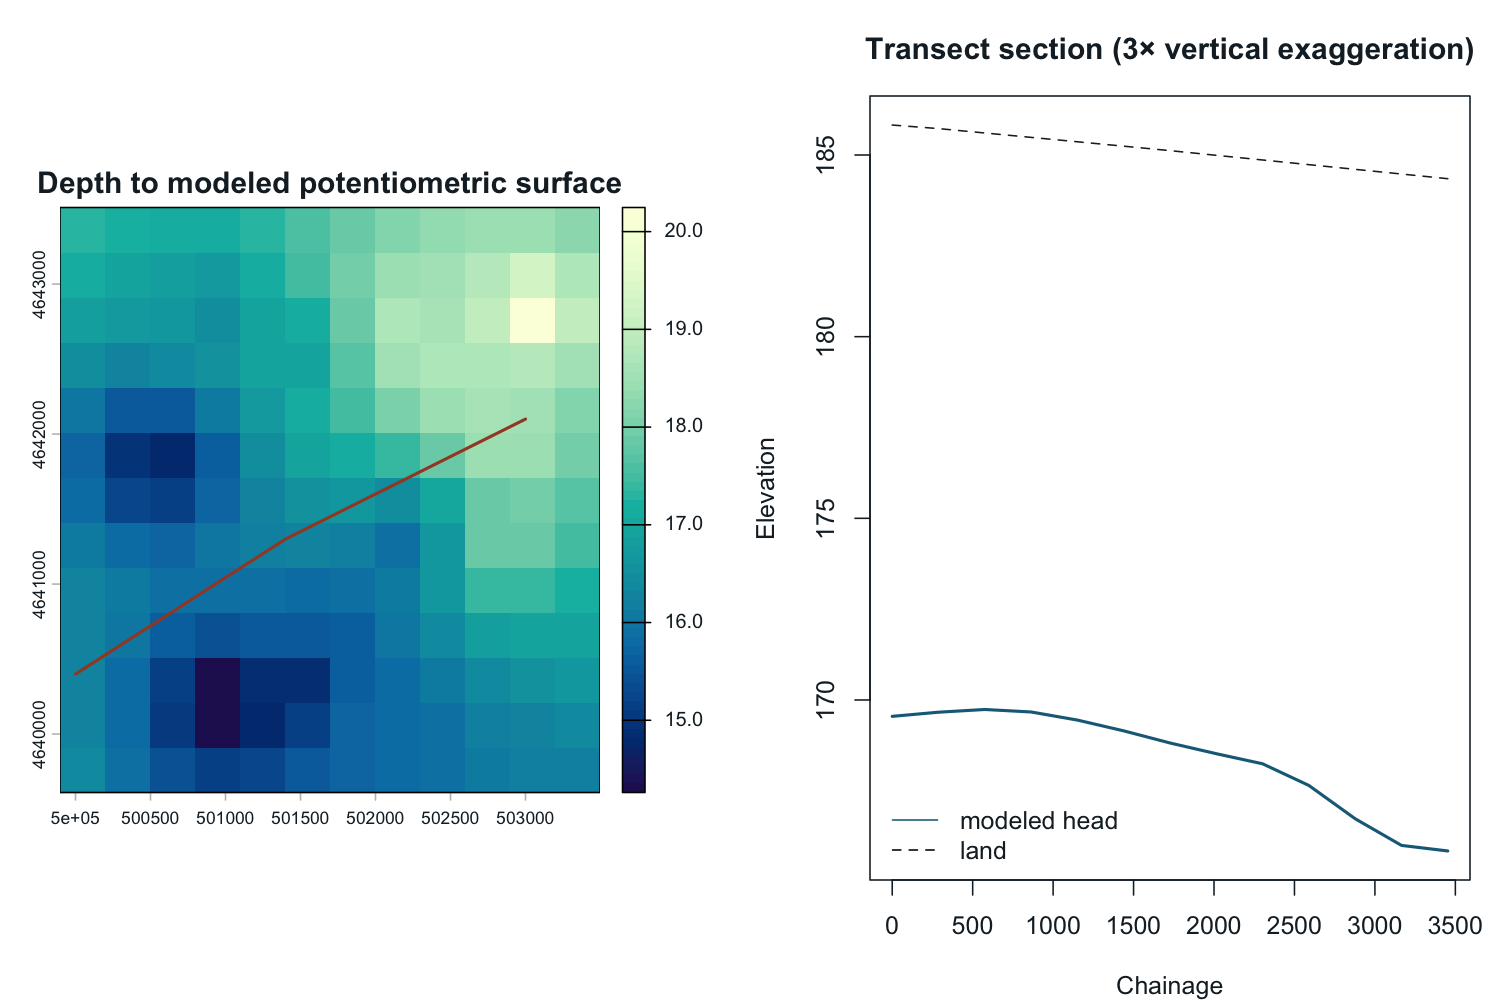
Depth surface and transect section
Methods: ps_depth_to_water_surface() and
ps_cross_section(). Units: synthetic
metres; section uses declared 3× vertical exaggeration. The section
samples surfaces and does not invent hydrostratigraphy.
Profiles and sections.
Hydraulic-gradient arrows in this gallery indicate decreasing modeled head. They do not represent groundwater velocity, travel time, particle paths, or contaminant transport.