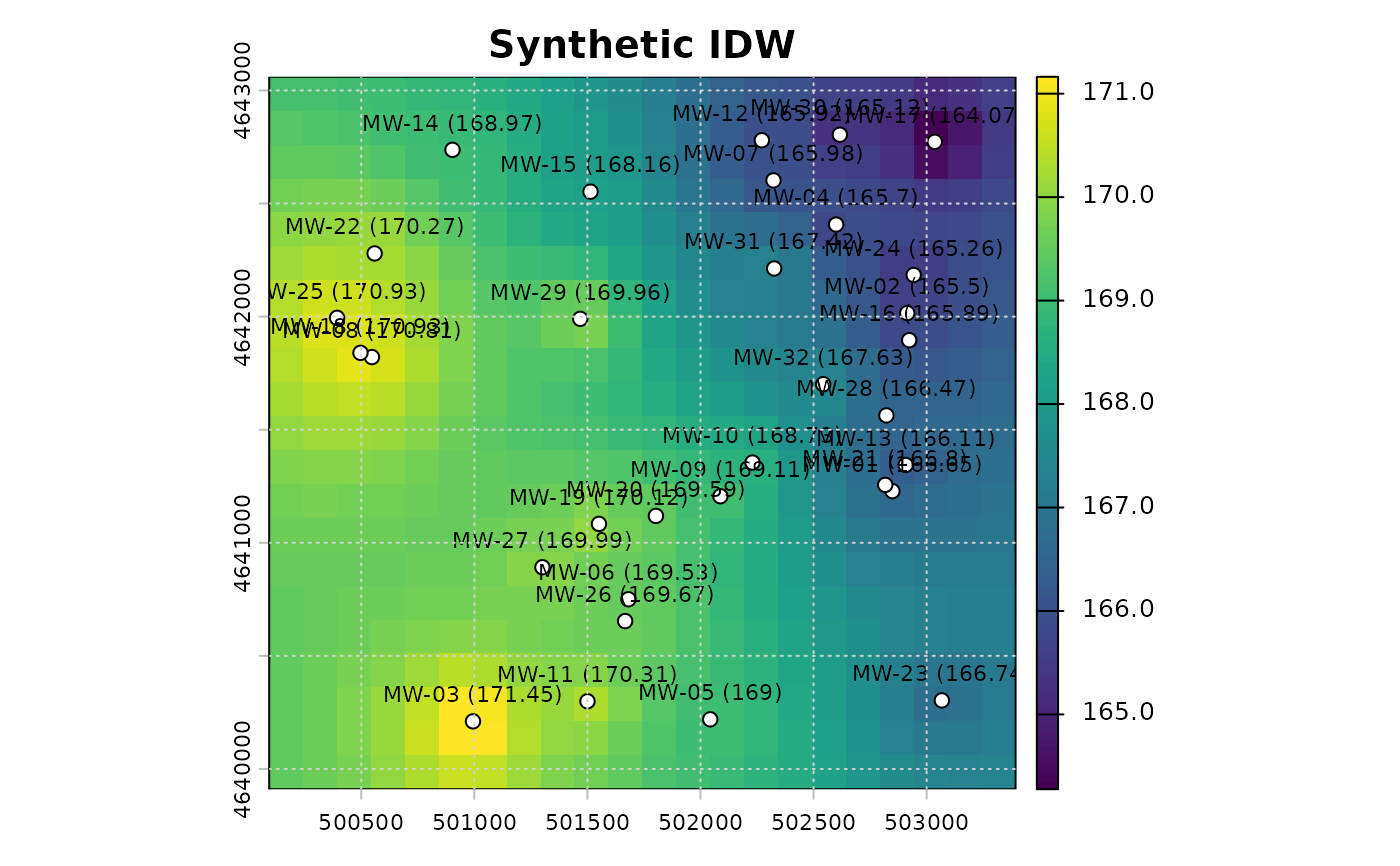
Draw a quicklook surface plot
ps_quicklook.RdDraw a quicklook surface plot
Usage
ps_quicklook(
  surface,
  contours = NULL,
  points = NULL,
  file = NULL,
  title = "Potentiometric surface",
  label_points = TRUE,
  width = 1600,
  height = 1200,
  res = 180,
  contour_units = NULL,
  label_contours = TRUE,
  overwrite = TRUE
)
Arguments
- surface
One-layer
SpatRaster.- contours
Optional contour
SpatVectoror contour result.- points
Optional observation points.
- file
Optional PNG path. No file is written when
NULL.- title
Plot title.
- label_points
Label points with
NameandZwhen available.- width, height, res
Positive PNG dimensions and resolution.
- contour_units
Optional units appended to contour labels.
- label_contours
Draw contour labels.
- overwrite
Overwrite
filewhen it exists.
Examples
data("synthetic_wells")
pts <- ps_make_points(synthetic_wells, "x", "y", "gw_elevation",
                      "well_id", "EPSG:26916")
surface <- ps_interpolate(pts, methods = "IDW", grid_res = 150)$IDW
ps_quicklook(surface, points = pts, title = "Synthetic IDW")